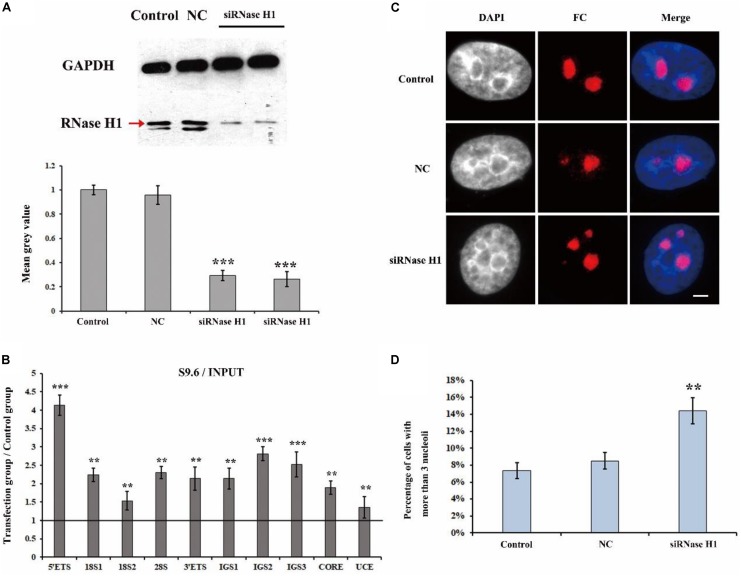
FIGURE 2.
The effect of knockdown of RNase H1 on the R-loops and nucleoli of HeLa cells. (A) Western blot was used to detect the efficiency of the knockdown of RNase H1. (B) ChIP analysis of R-loops at the rDNA regions in HeLa cells after transfection with RNase H1 short-interfering RNA (siRNase H1) for 48 h. The y-axis indicates the ratio of the relative quantities of rDNA in the experimental group HeLa cells to the relative quantities of rDNA in control group HeLa cells. The x-axis indicates different regions of rDNA amplicons. Relative values were normalized to the input. Each experiment was repeated three times, and the average value and SD are shown. (C) HeLa cells were transfected with negative control siRNA (NC) or siRNase H1 for 48 h and then indirect immunofluorescence staining with the anti-fibrillarin antibody was used to detect the nucleoli. Scale bar = 3 μm. (D) Percentages of interphase nuclei with more than three fragmented nucleoli after transfection with siRNase H1 for 48 h. The number of evaluated nuclei in each group was 300. Data are expressed as *P < 0.05, **P < 0.01, and ***P < 0.001, measured by the t-test.

