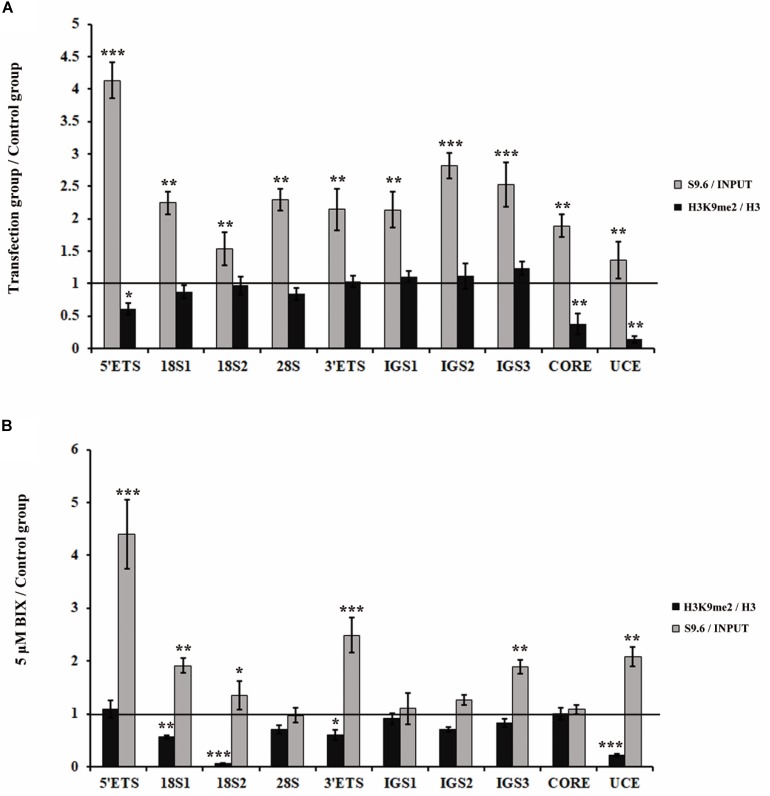
FIGURE 3.
Analysis of the relationship between H3K9me2 and R-loops at rDNA sites in HeLa cells. (A) ChIP analysis showed the level of histone H3K9me2 and R-loops at the rDNA regions after transfection with siRNase H1 for 48 h. The y-axis indicates the ratio of the relative quantities of rDNA in the experimental group HeLa cells to the relative quantities of rDNA in control group HeLa cells. The x-axis indicates different regions of rDNA amplicons. Relative values of H3K9me2 were normalized to those of the total H3 and relative values of R-loops were normalized to the input. Each experiment was repeated three times, and the average value and SD are shown. (B) ChIP analysis of R-loops and the levels of H3K9me2 at the rDNA regions in HeLa cells after treatment with or without BIX for 48 h. Each experiment was repeated three times, and the average value and SD are shown. Data are expressed as *P < 0.05, **P < 0.01, and ***P < 0.001, measured by the t-test.

