
Figure 3.
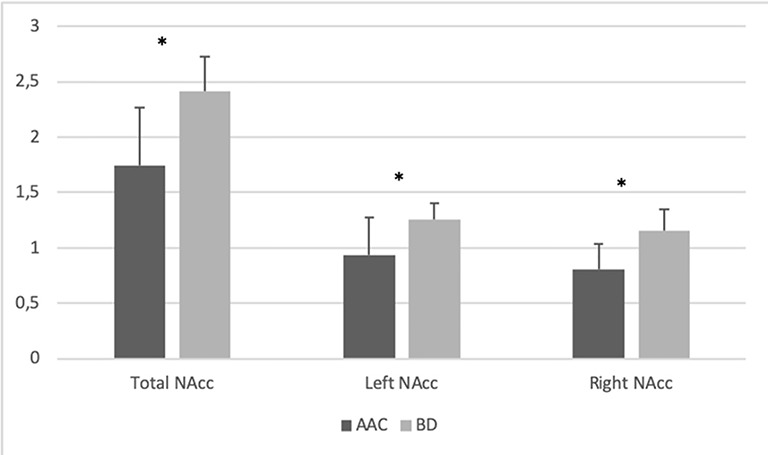
Illustrates the NAcc mean volumes (ml) in the BD and AAC groups. Error bars represent standard deviations. *P ≤ 0.001
Official websites use .gov
A
.gov website belongs to an official
government organization in the United States.
Secure .gov websites use HTTPS
A lock (
) or https:// means you've safely
connected to the .gov website. Share sensitive
information only on official, secure websites.
Illustrates the NAcc mean volumes (ml) in the BD and AAC groups. Error bars represent standard deviations. *P ≤ 0.001