Figure 4.
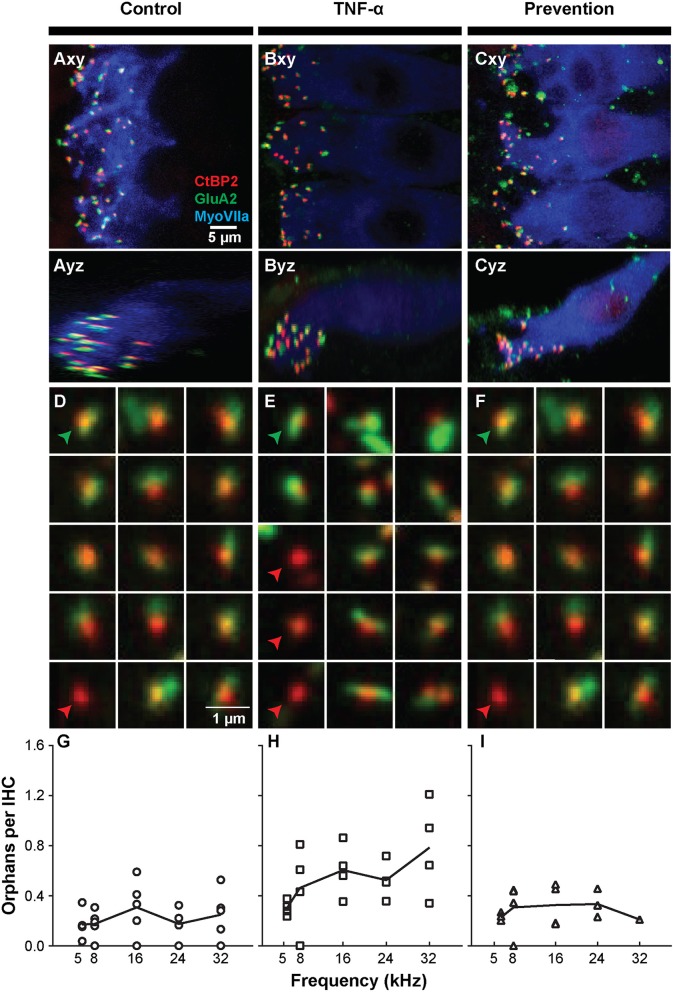
Intracochlear TNF-α perfusion increases the number of orphaned synapses at the basal pole of inner hair cells. Left column shows results from the control group (perfused with artificial perilymph); middle column shows results from the TNF-α group; right column shows results from the prevention group (animals received etanercept 2 h prior to receiving TNF-α). (A–C) Representative confocal images of inner hair cells (IHCs) immunostained for myosin VIIa (blue) with pre-synaptic ribbons stained for CtBP2 (red) and post-synaptic terminals stained for GluA2 (green). Images from the 32-kHz region show maximum projections from “surface” views (xy) of three adjacent IHCs and side views (yz) of the same confocal image stacks. Green arrowheads point to a paired synapse, i.e., CtBP2- and GluA2-positive puncta, indicating presence of a communicating post-synaptic terminal. Red arrowheads point to unpaired (orphaned) synapses, i.e., CtBP2-positive puncta. Scale bar in (A) also applies to (B,C). (D–F) Custom software automatically detects and segments ribbon synapses based on presence of the CtBP2 label and associated fluorescence signal. Representative “thumbnail” images depicting detected ribbons in control (D), TNF-α (E), and prevention (F) conditions demonstrate the reduced number of ribbons with paired post-synaptic terminals in the TNF-α condition relative to the control and prevention conditions. Each thumbnail depicts the x-y projection of the voxel space within 1 μm of a CtBP2-indicative punctum. Green arrowhead, paired synapses; red arrowhead, unpaired (orphaned) synapse. (G–I) The number of orphaned ribbon synapses per inner hair cell at 5.6, 8, 16, 24, 32 kHz in control (G; n = 5), TNF-α (H; n = 4), and prevention (I; n = 4) groups. Each symbol in a panel represents an individual animal. There is a significant difference between the three experimental groups at 24 kHz [χ2 (2) = 9.05, p = 0.001] and 32 kHz [χ2 (2) = 7.06, p = 0.018]. Further, the number of orphaned synapses at 32 kHz is statistically greater in the TNF-α group relative to the control group [χ2 (1) = 4.86, p = 0.03] and prevention group [χ2 (1) = 5.33, p = 0.03]. Similarly, the number of orphaned synapses at 24 kHz is statistically greater in the TNF-α group relative to the control group [χ2 (1) = 6.0, p = 0.02].

