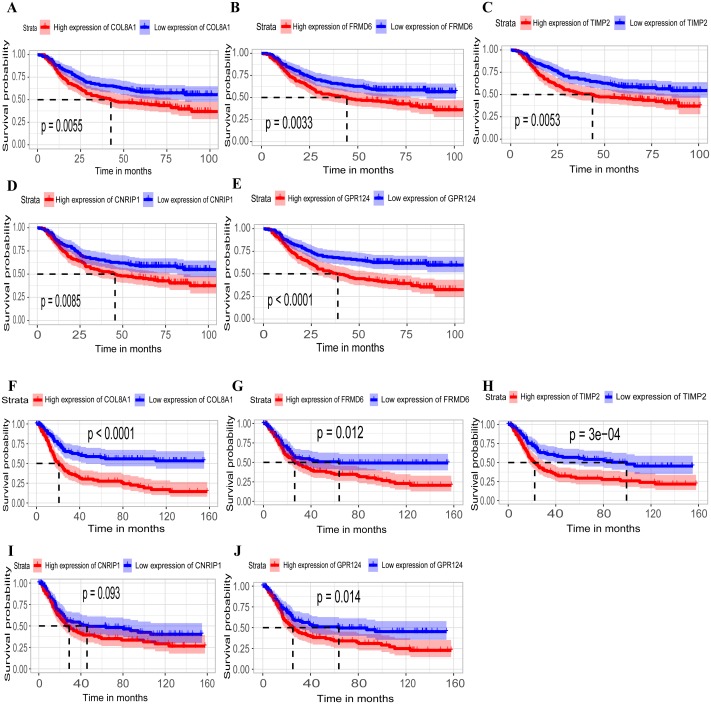
Figure 4. Identification of hub genes in the training set and confirmed in the validation set.
(A–E) Relationship between overall survival (OS) and the five key hub genes (COL8A1, FRMD6, TIMP2, CNRIP1, GPR124) in the training dataset. Kaplan-Meier survival curve plots for OS are shown (gastric cancer patients were grouped by the median of the expression level of hub genes). Increased expression of the five genes indicated poor overall survival. Additionally, the relationship between OS and the five key hub genes in the validation dataset was presented in (F–J). Red lines represent high expression of the real hub genes and blue lines represent low expression. The “+” symbol in the panel indicated censored data. The dashed line in KM curves mean the median survival. It defined that the survival time corresponding to a cumulative survival rate of 0.5 means that only 50% of individuals can live this time.

