. 2020 Feb 14;34(12):e201901204. doi: 10.1590/s0102-865020190120000004

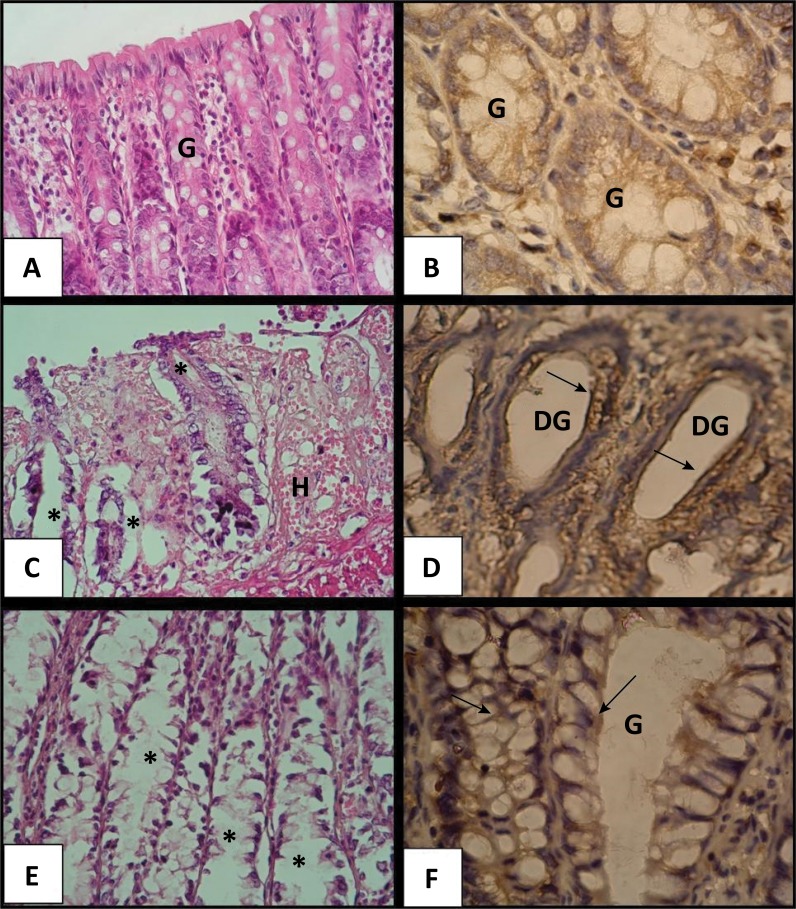
Figure 1. Microscopic images of rectum sections of rats with acute ulcerative colitis. a: The control group with the normal intestinal glands (G), b: Control group with low expression of NF-kB in the normal intestinal glands, c: Colitis and saline treatment group with damaged intestinal glands (asterisks) and severe hemorrhage (H), d: Colitis and saline treatment group with damaged intestinal glands (DG) and increased expression of NF-kB (arrows), e: Colitis and adenosine treatment group with healing intestinal glands (asterisks) and reduced hemorrhage, f: Colitis and adenosine treatment group with decreased expression of NF-kB (arrows) in healing intestinal glands (G). a, c, e: Hematoxylin and eosin stain (X40); b, d, f: NF-kappa B immunohistochemistry (X100).

Figure 1