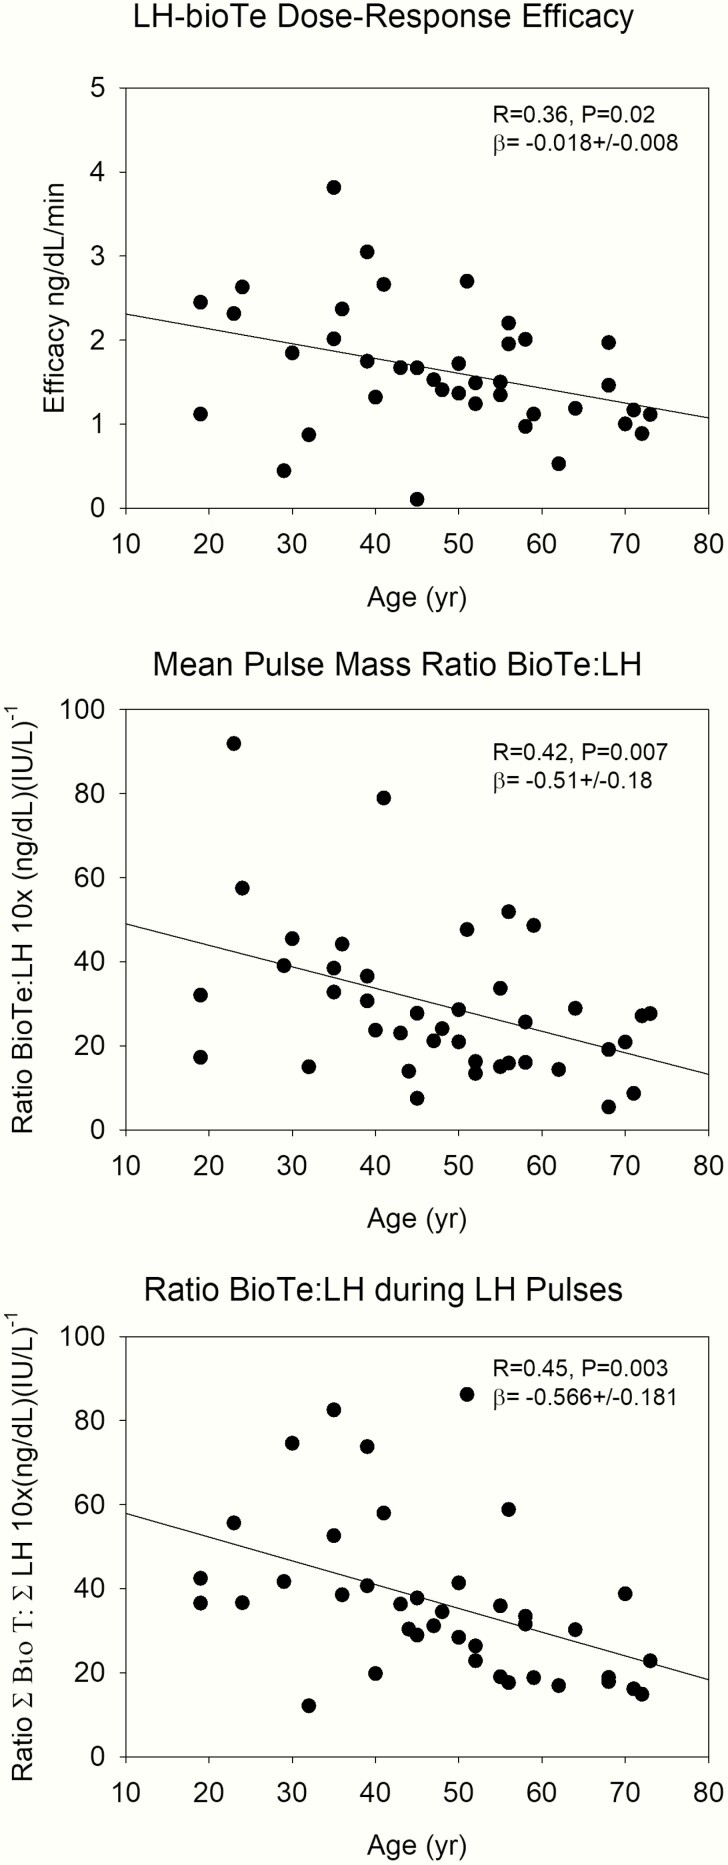
Figure 8.
Regression of Leydig cell responsivity to LH pulses on age, estimated by 3 different methods. The upper panel shows analytical reconstruction of the efficacy of the endogenous LH-Te dose-response relation. The middle panel gives the ratio of mean LH and bioavailable Te pulse mass calculated by deconvolution analysis, and the lower panel the ratio of the integrated areas, calculated with the trapezoidal method.

