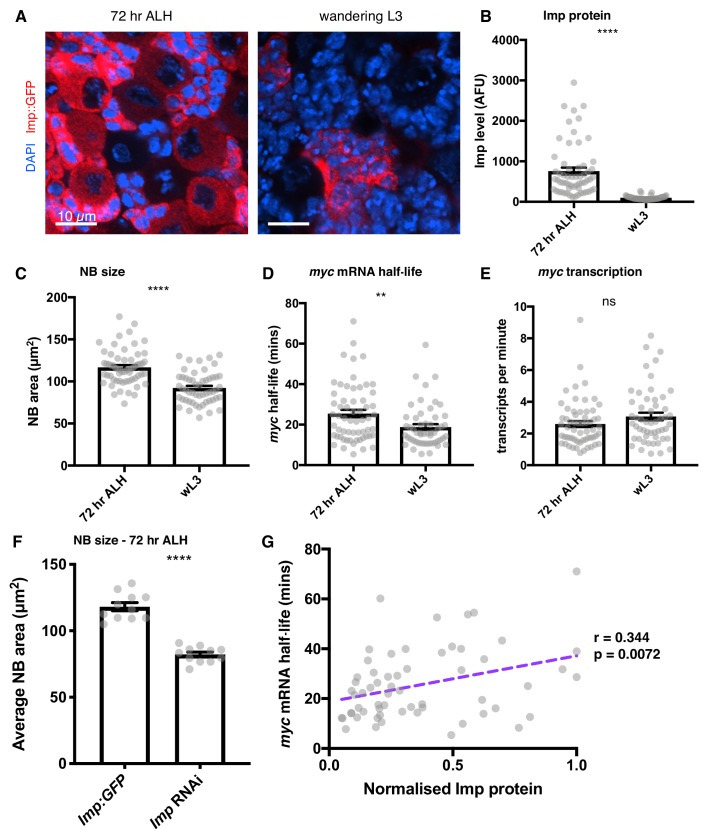
Figure 6. Imp stabilises myc mRNA throughout larval development.
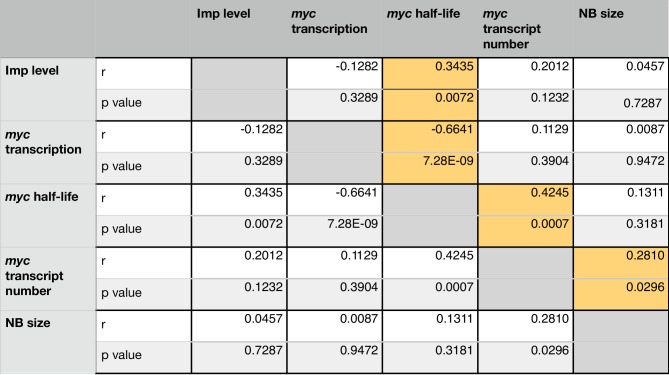
(A) Imp level (measured with endogenous Imp::GFP) is higher in NBs at 72 hr ALH compared to the wL3 stage, and is more variable between different type I NBs. Imp is very highly expressed in the progeny cells so the image is contrasted to show the Imp levels in the NBs. (B) Imp level quantitated in 72 hr ALH and wL3 type I NBs. (C) NBs are larger at 72 hr ALH compared to wL3. (D) myc mRNA half-life is longer in 72 hr ALH NBs compared to wL3. (E) The transcription rate of myc is not significantly different between 72 hr and wL3 NBs. Significance was calculated using unpaired t test. ns = not significant, **p<0.01, ****p<0.0001 F Measuring the size of type I NBs at 72 hr ALH shows wild type (imp::GFP) NBs are larger than Imp knockdown NBs. (G) In individual NBs at 72 hr ALH, increased Imp expression correlates with increased myc mRNA half-life. Imp level is normalised to the highest expressing NB from each imaging session. Each grey point represents one NB and for each stage, brains were analysed from three experimental replicates.


