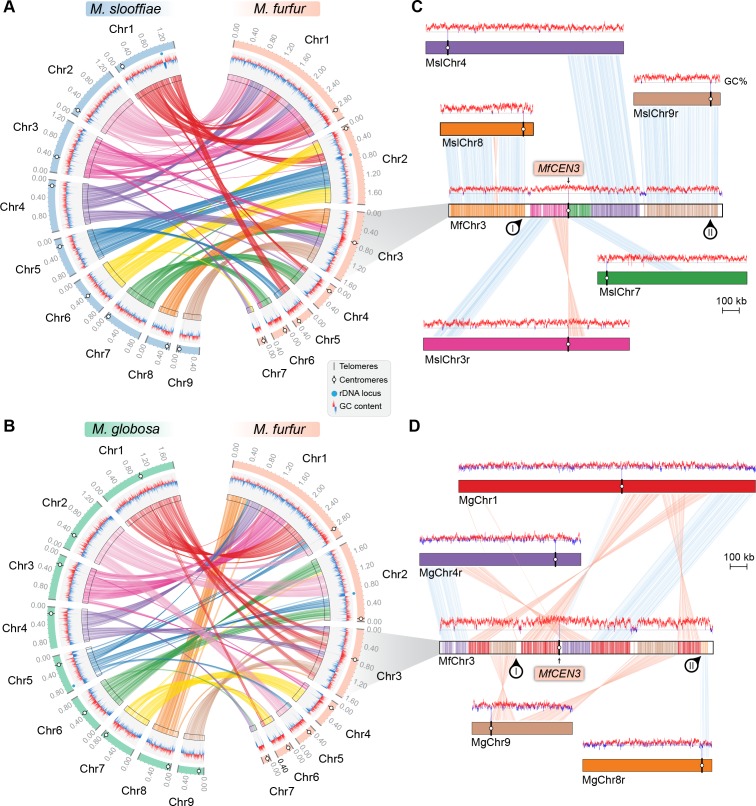
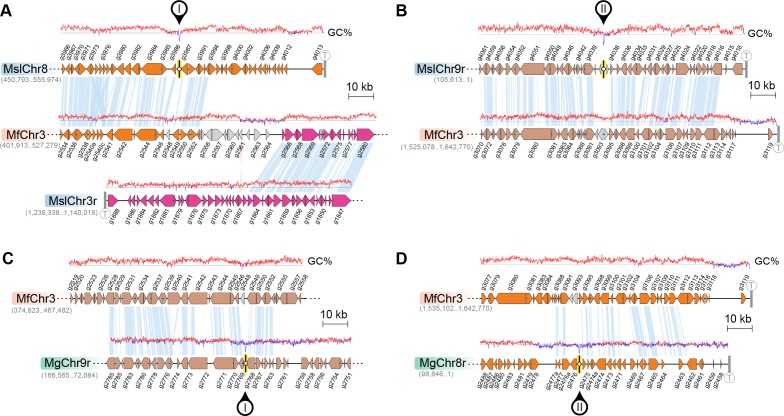
Figure 6. Inactivation of CEN8 and CEN9 of M. slooffiae and M. globosa in MfChr3 resulted in reduction in chromosome number in M. furfur.
(A, B) Circos plots depicting the gene synteny blocks that are conserved between the M. slooffiae or M. globosa chromosomes and the M. furfur chromosomes. Tracks from outside to inside represent positions of centromeres and telomeres, GC content (plotted as blue and red lines indicating GC content below or above genome average, calculated in 0.4-kb non-overlapping windows), and colored connectors indicate regions of conserved gene synteny between each pair of two species. (C) Linear chromosome plot depicting the regions that show synteny between Chr3 of M. furfur and Chr3, Chr4, Chr7, Chr8, and Chr9 of M. slooffiae. GC content (in %) is shown as red/blue lines above each chromosome. Regions corresponding to MslCEN8 and MslCEN9 in MfChr3 are marked I and II, respectively. (D) Linear chromosome plot depicting the conservation of gene synteny between Chr3 of M. furfur and Chr1, Chr4, Chr8, and Chr9 of M. globosa. Regions corresponding to MgCEN9 and MgCEN8 in MfChr3 are marked I and II, respectively.


