. 2020 Jan 20;9:e53944. doi: 10.7554/eLife.53944

Figure 7. Karyotype evolution by loss of centromere function in Malassezia species.

(A) Phylogenetic relationships between the Malassezia species analyzed in this study are represented and their chromosome numbers are shown. Species representing each clade are color-coded on the basis of previous reports (Theelen et al., 2018). The chromosome numbers for M. slooffiae and M. globosa are based on results from this study. In the case of M. sympodialis, M. restricta, and M. furfur, the chromosome numbers are based on previous reports (Boekhout and Bosboom, 1994; Senczek et al., 1999; Zhu et al., 2017). For M. dermatis, M. nana, M. vespertilionis, and M. japonica, the number of chromosomes were estimated from the predicted number of centromeres. The nodes corresponding to the ancestral state for Clade A and Clade B are labeled ‘Anc. A’ and ‘Anc. B’, respectively. Green and red circles indicate the origins of karyotypes that have eight and seven chromosomes, respectively, from an ancestral state of nine chromosomes. (B) Schematic of the centromere loss by breakage and the resulting reduction in chromosome number as observed in M. sympodialis (represented as the current state). A karyotype with nine chromosomes (as shown for M. globosa) is depicted as the ancestral state. (C) Proposed model of centromere inactivation observed in M. furfur as a consequence of fusion of AnChr8 and AnChr9 to the AnMfChr3 equivalent, resulting in a seven-chromosome configuration. The fusion product corresponding to extant MfChr3 is represented as the current state.

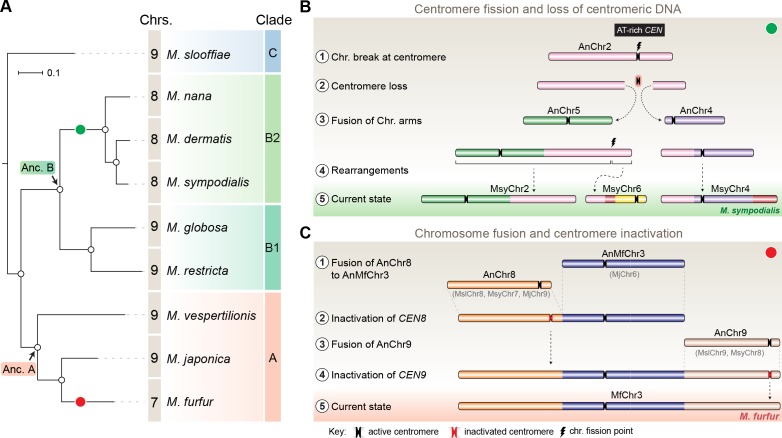
Figure 7.

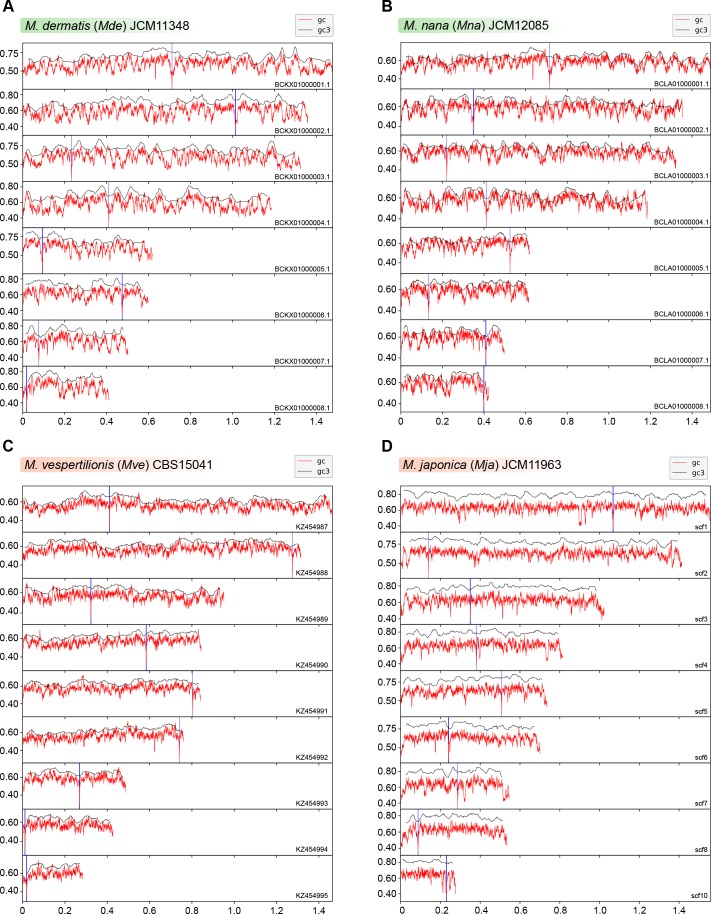
Figure 7—figure supplement 1. Putative centromeres of M. dermatis, M. nana, M. vespertilionis, and M. japonica map to global GC troughs in each chromosome.

Figure 7—figure supplement 1.

(A–D) Graphs indicating the GC content (red lines) and GC3 content (black lines) of each chromosome of M. dermatis, M. nana, M. vespertilionis, and M. japonica. The positions of putative centromeres mapping to chromosomal GC minima are marked in blue. The x-axis indicates chromosomal coordinates in Mb.
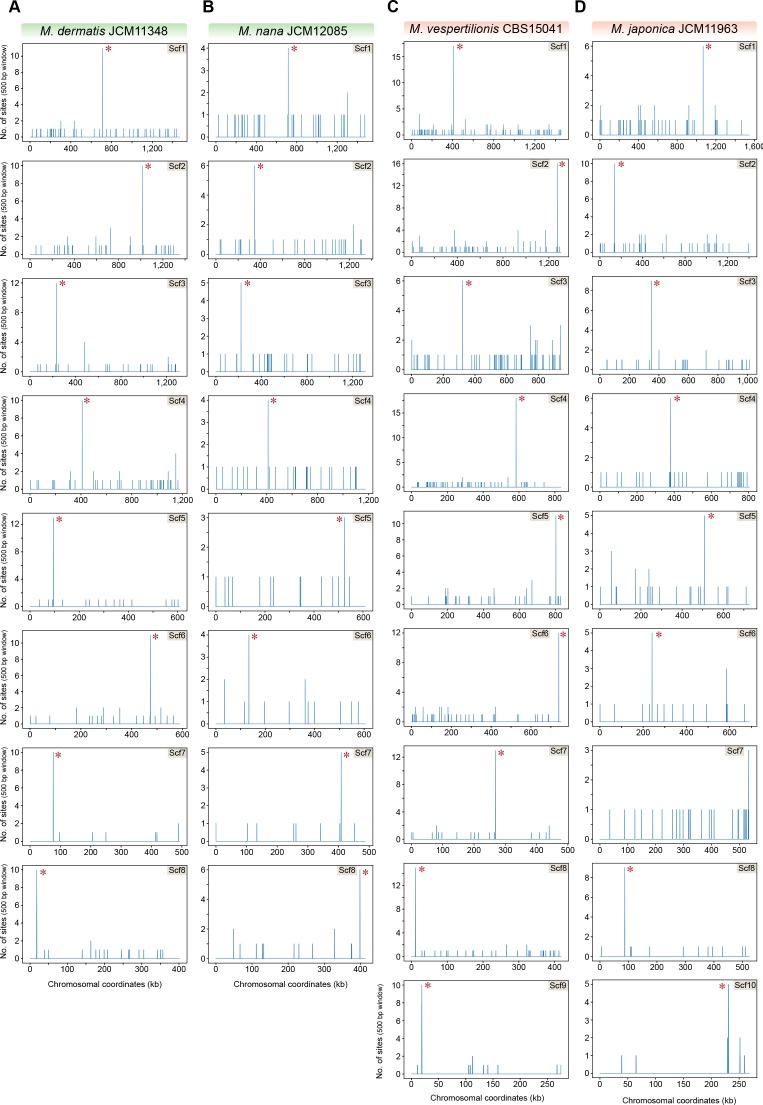
Figure 7—figure supplement 2. The 12-bp AT-rich motif is enriched at the putative centromeres of M. dermatis, M. nana, M. vespertilionis, and M. japonica.

Figure 7—figure supplement 2.

The genomes of M. dermatis, M. nana, M. vespertilionis, and M. japonica were scanned for matches to the 12-bp AT-rich motif using a 500 bp sliding window. Hit counts (y-axis) were plotted against the chromosomal coordinates (x-axis, in kb) for each of the above species. Red asterisks near the line corresponding to maximum enrichment in every chromosome or scaffold mark the regions predicted as centromeres in each species.
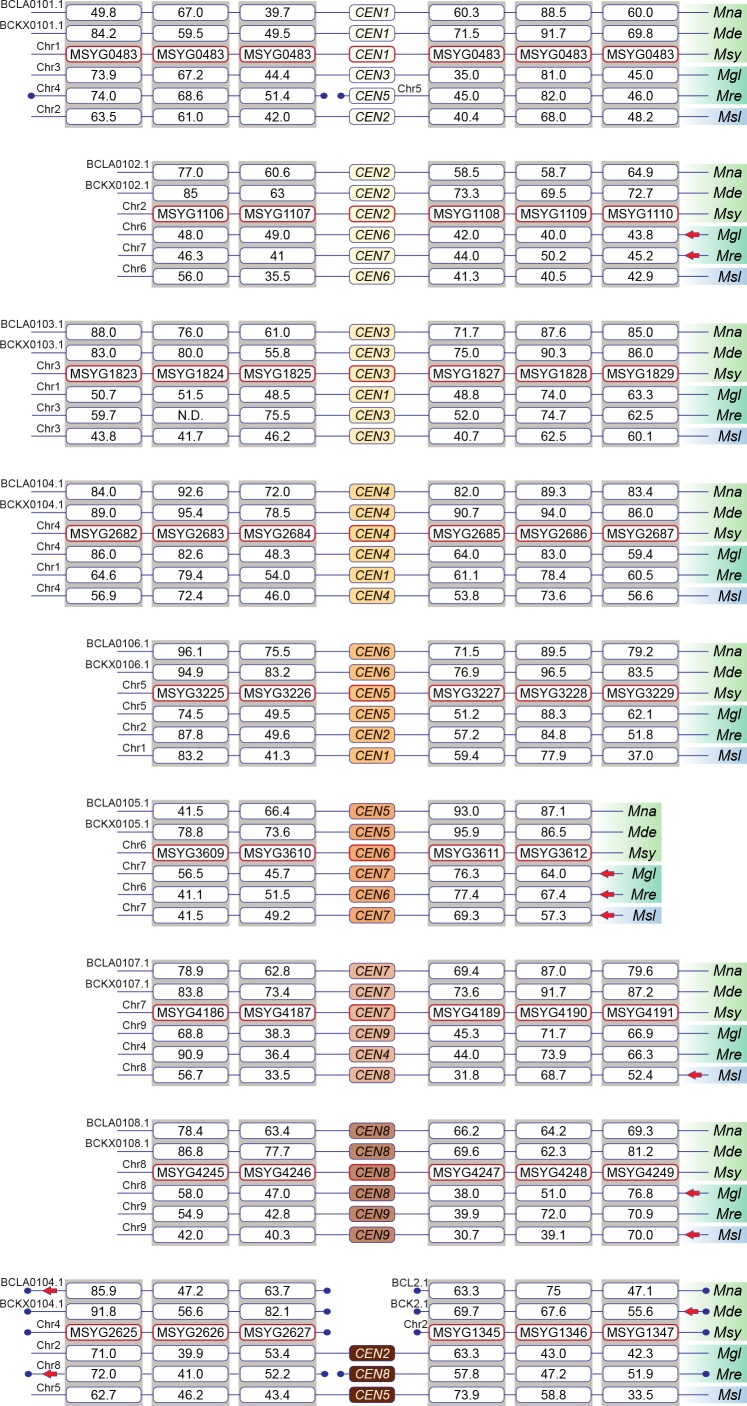
Figure 7—figure supplement 3. All of the predicted centromeres of M. sympodialis, M. nana, and M. dermatis belong to gene synteny blocks that are also conserved in species containing nine chromosomes.

Figure 7—figure supplement 3.

The gene order and synteny of ORFs flanking the centromeres of six Malassezia species, which are representative of clades B and C, analyzed by BLAST analysis using the protein sequences from M. sympodialis as query. Species included are: Mna, M. nana; Mde, M. dermatis; Msy, M. sympodialis; Mgl, M. globosa; Mre, M. restricta; and Msl, M. slooffiae. Chromosome/scaffold numbers are indicated at the start of every track. Boxes represent ORFs with the numbers inside them indicating percentage identity from BLAST analysis. Broken lines marked with a filled circle towards the ends indicate gene synteny breakpoints. Red arrows indicate inverted orientation of the scaffold/chromosome.
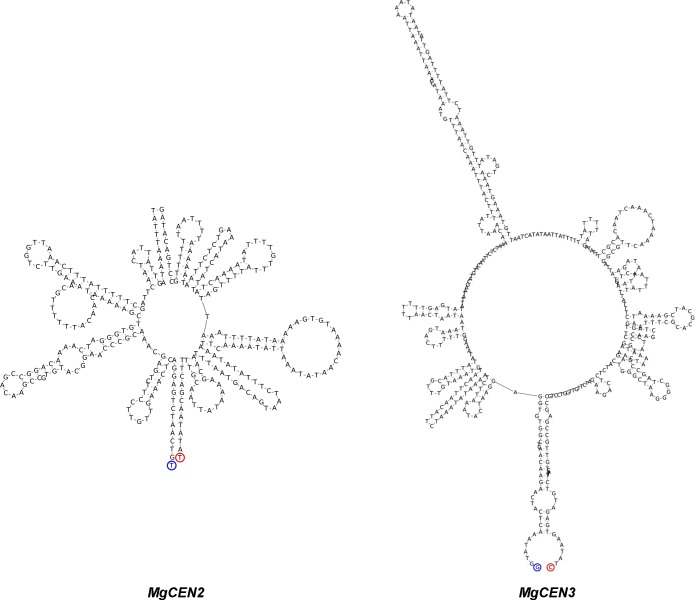
Figure 7—figure supplement 4. MgCEN2 and MgCEN3 are predicted to form secondary structures.

Figure 7—figure supplement 4.

The secondary structure of the centromere cores of MgCEN2 and MgCEN3 predicted by the ViennaRNA, generated using Geneious 9.0 (Lorenz et al., 2011). Blue and red circles mark the 5′- and the 3′- DNA ends, respectively.