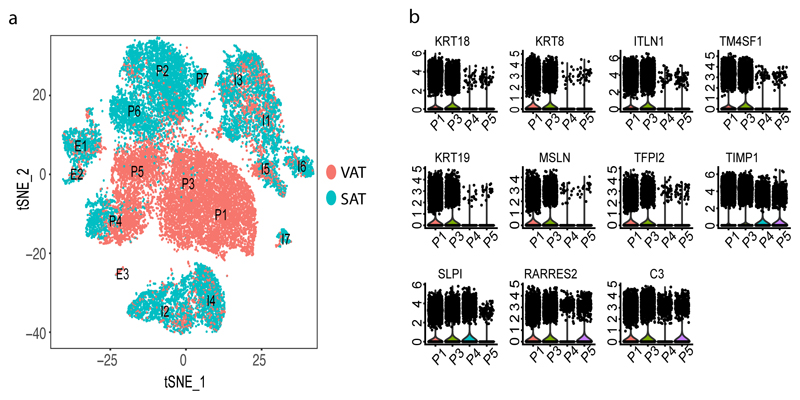
Figure 4. Main cell clusters in SVF based on depot.
(a) Clustering results of all SVF samples that underwent single-cell RNA sequencing which identified 17 clusters from 26,350 cells. Clusters were classified as Progenitors (P), Immune cells (I) and Endothelial cells (E) and labelled accordingly. Cells are labelled as VAT (red)- or SAT (blue)-derived, respectively. (b)Violin plots of expression density of 11 genes that are specific to VAT progenitor clusters. The y axis indicate log transformed expression values and the width indicate number of cells expressing the particular gene.

