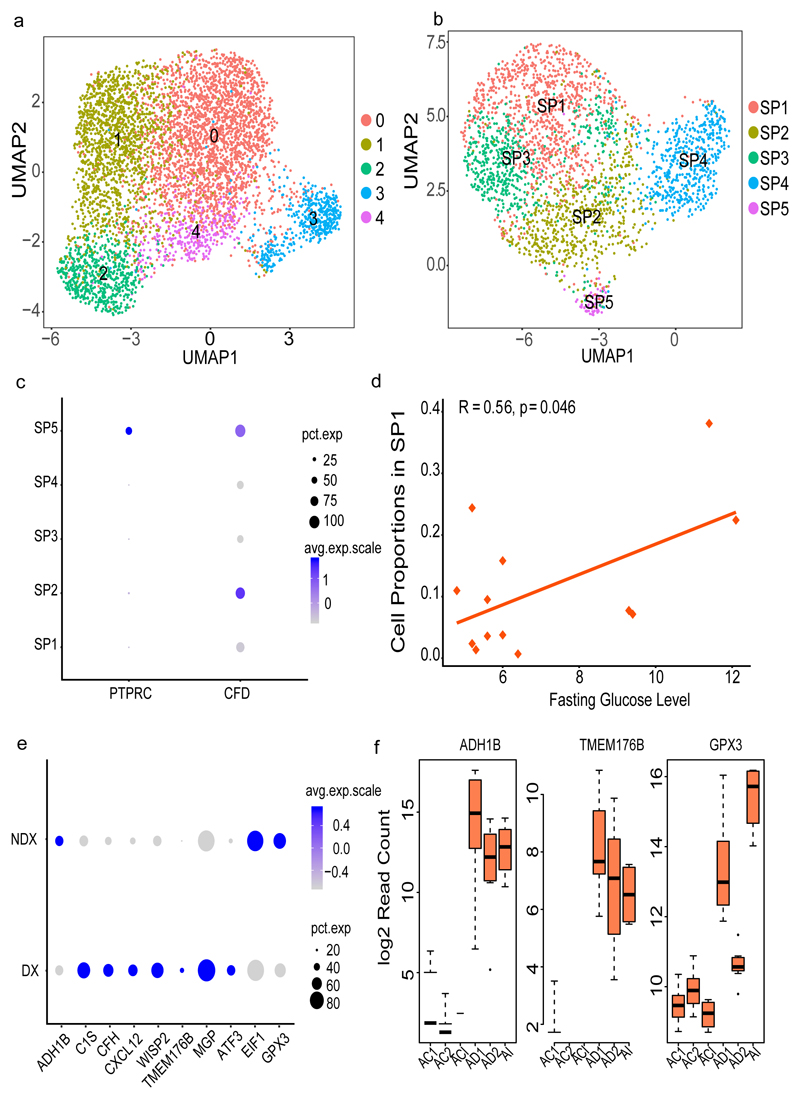
Figure 5. Progenitor clusters specific to SAT.
(a) Re-clustering of SAT-specific progenitors from the complete sample set of 26,350 cells (b) Re-clustering of SAT-specific progenitors (2,705 cells) by subsampling the high coverage library to 1500 cells (c) Dot plot of the expression of PTPRC (CD45) and CFD across SAT progenitors (SP1-SP5). (d) Pearson correlation of fasting glucose levels (mmol/L) and SP1 proportion across all samples obtained from 13 individuals (e) Dot plot of differentially expressed SP1 genes in cells derived from T2D (DX) versus non-T2D (NDX) samples previously validated in the MuTHER study (f) Box plot of T2D-associated SP1 gene expression at different time points of adipocyte differentiation from mesenchymal stem cells (MSCs, n= 8 individuals). AI corresponds to the first time point three days after culturing MSCs in the induction media. AD1 and AD2 are 1 and 2 weeks of differentiation in adipogenic media after the AI timepoint. ACI, AC1 and AC2 are corresponding control sets for AI, AD1 and AD2 without any adipocyte differentiation treatments. Each timepoint with corresponding control includes three independent MSC cultures and shown by average log 2 read count and error bars corresponding to standard deviation. The black line inside the boxplot represent and median value and the size of the box is determined by the 25th and 75th percentile of the data. The wiskers of box plot represents the maximum and minimum values of the data shown. The size of the dot in (c) and (e) corresponds to the percentage of cells expressing the genes in each cluster and the color represents the average expression level.

