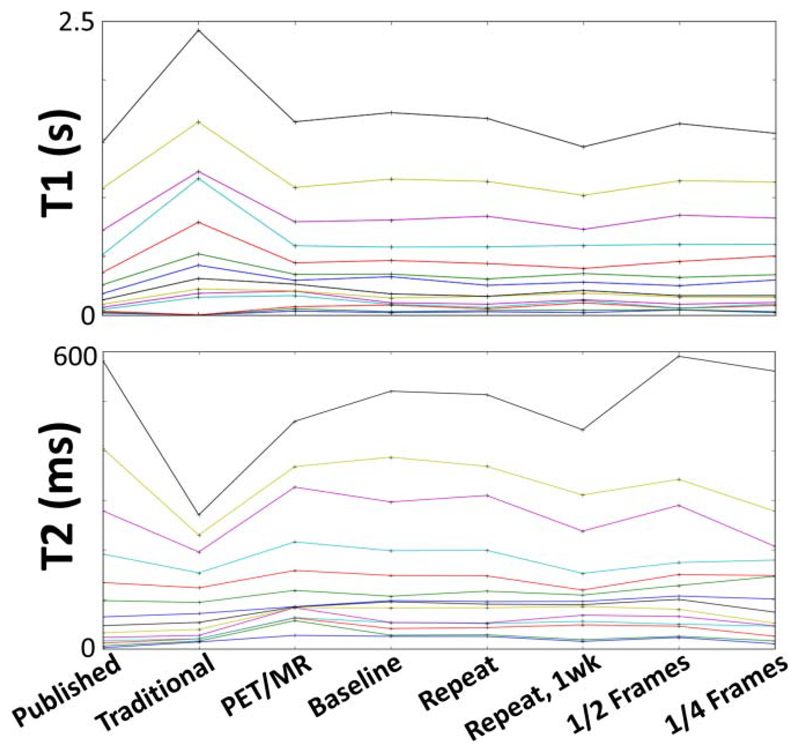
Fig. 2.
T1 and T2 values measured in the ISMRM/NIST phantom vials (of the T1-slice and T2-slice of the phantom, respectively). Each horizontal line corresponds to a single vial, which would be constant with repeatable and reproducible conditions. The labels indicate values obtained from: Published values in the NIST manual; Traditional quantification with standard T2 multiecho spin echo (MESE) or T1 VFA mapping; using the PET/MR; on the clinical system (Baseline), Repeated after an hour and after 1 week, and using a reduced number of Frames (1/2 or 1/4) when compared with baseline (frames = 979).

