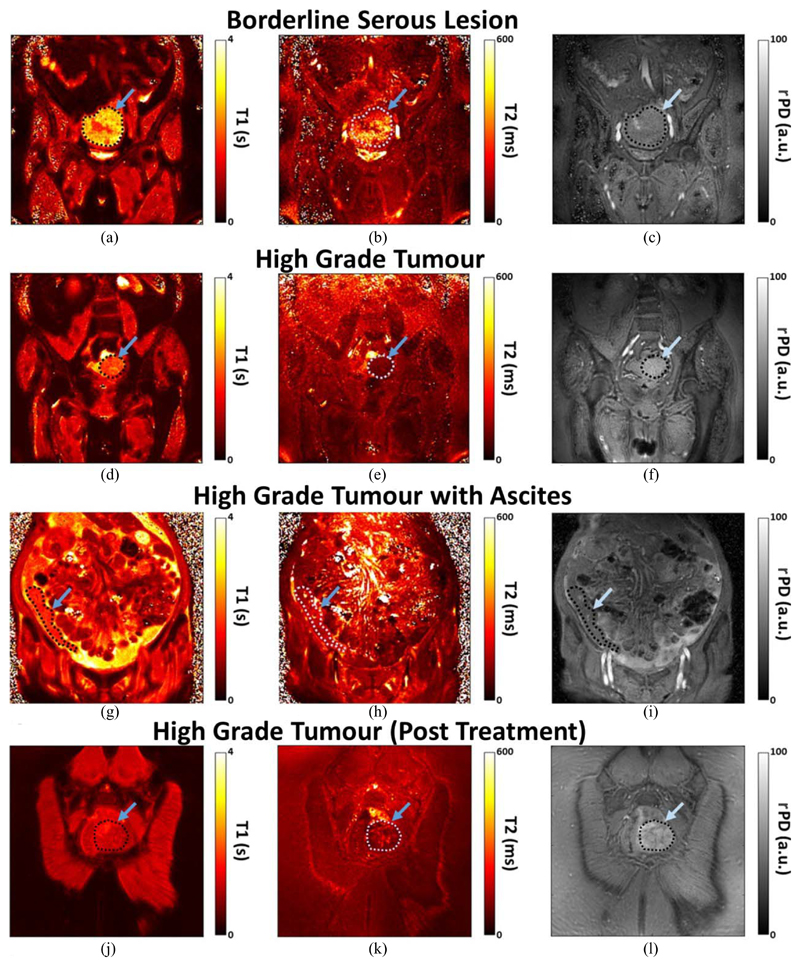
Fig. 4.
Coronal T1, T2, and PD quantitative maps of the four patients with (a)–(c) borderline serous and (d)–(l) high grade tumors. One of the HGSOC tumors had extensive ascites, and the HGSOC patient who had treatment had no histological evidence of remaining carcinoma (j)–(l). The T2 images (b), (e), (h), and (k) are shown with a maximum scale of 600 ms, although the dictionary was created up to values of 2.5 s.

