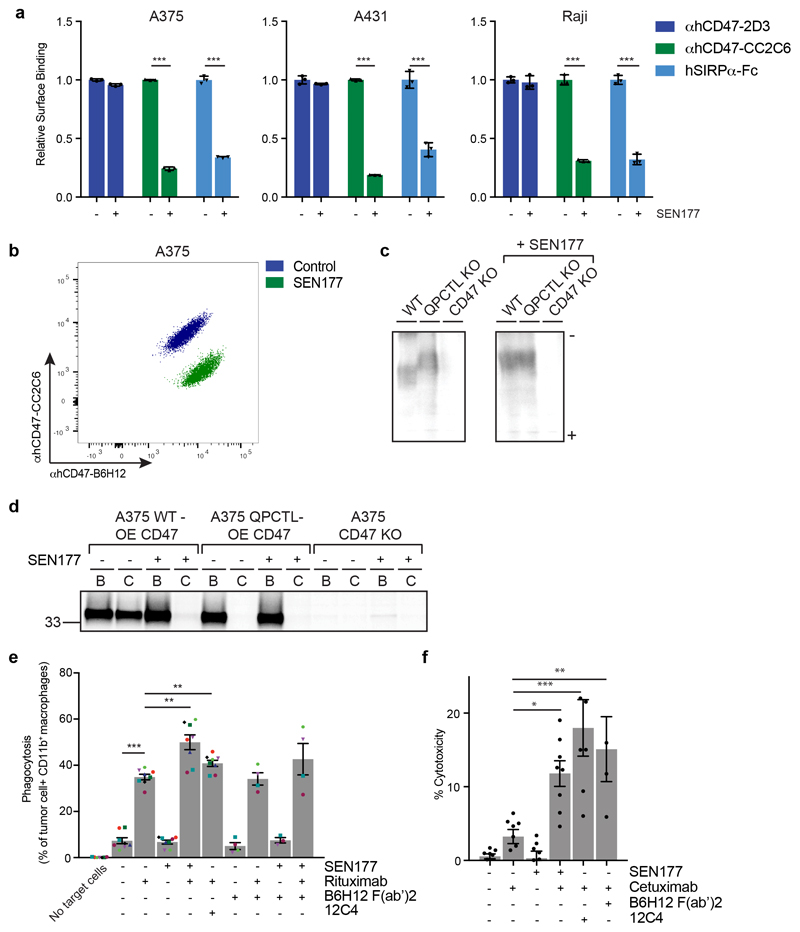
Fig. 3. Synergy between blockade of CD47 pyroglutamate formation and tumor opsonization in tumor cell killing by macrophages and neutrophils.
a, Cell surface binding of αhCD47-2D3, αhCD47-CC2C6 and hSIRPα-Fc to control (DMSO)-treated (-) or SEN177-treated (+) melanoma (A375), epidermoid carcinoma (A431) and Burkitt’s lymphoma (Raji) cells, as determined by flow cytometry. Values indicate MFI relative to WT cells stained with the same reagent. Data represent n=3 biological replicates and mean ± s.d. of triplicates. ***P≤0.000373 by unpaired two-sided t-test.
b, Flow cytometry plot of surface binding of αhCD47-B6H12 and αhCD47-CC2C6 to control-treated or SEN177-treated melanoma (A375) cells. Data are representative of two independent experiments with similar results (n=3 biological replicates per experiment).
c, Isoelectric focusing analysis of αhCD47-B6H12 immunoprecipitates from CD47-HA-overexpressing WT, CD47-HA-overexpressing QPCTL KO, or CD47 KO melanoma (A375) cells left untreated (-) or treated with SEN177 (+). Data are representative of two independent experiments with similar results. Gel image is cropped to show the relevant bands. See Source Data for the uncropped gel.
d, SDS-PAGE analysis of αhCD47-B6H12 (B) or αhCD47-CC2C6 (C) immunoprecipitates from CD47-HA-overexpressing WT, QPCTL KO (cl4.1), or CD47 KO melanoma (A375) cells after a 30’ 35S methionine/cysteine labelling in the presence (+) or absence (-) of SEN177. Data are from one experiment. Blot image is cropped to show the relevant bands, and molecular mass markers are indicated (in kD). See Source Data for the uncropped western blot.
e, Phagocytosis of control-treated (DMSO) (-) or SEN177-treated (+) Burkitt’s lymphoma (Raji) cells in the presence or absence of the anti-human CD20 antibody rituximab, CD47-blocking F(ab’)2 fragment B6H12, or SIRPα blocking antibody 12C4 by human macrophages, as determined by ImageStream analysis. Symbols represent individual donors. Data represent mean ± s.d. of independent donors. ***P<0.0001; 0.0027≥**P≥0.0024 by one-way ANOVA.
f, Specific lysis of control-treated (-) or SEN177-treated (+) epidermoid carcinoma (A431) cells by human neutrophils in the presence or absence of the anti-human EGFR antibody cetuximab, CD47-blocking F(ab’)2 fragment B6H12, or SIRPα blocking antibody 12C4 in a 4 hour 51Cr-release assay. Data represent mean ± s.d. of independent donors. *P=0.0207; **P=0.0055; ***P<0.0001 by one-way ANOVA.
Data are representative of at least two independent experiments (a, b, e, f), evaluating effector cells from 4 donors (for B6H12(Fab’)2 conditions) or 8 donors (all other conditions) (e, f).

