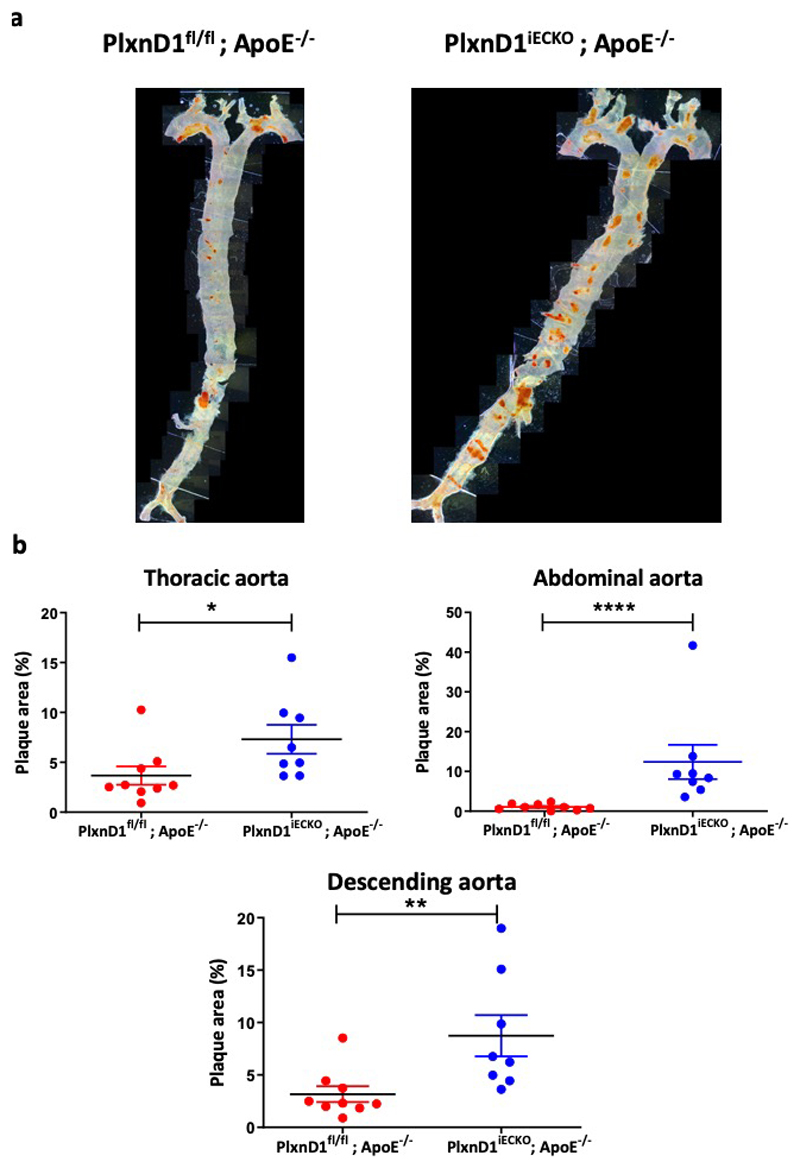
Extended Data Figure 5. Atherosclerosis in the descending aorta.
(a) Representative en face preparations of the whole aorta showing atherosclerosis in PlxnD1fl/fl; ApoE-/- and Plxn D1iECKO; ApoE-/- mice after 20 weeks of high fat diet feeding, visualised by Oil red O staining. (b) Quantification of lesion area in the thoracic aortas, abdominal aortas and whole descending aortas (thoracic aorta+abdominal aorta) from PlxnD1fl/fl; ApoE-/- and PlxnD1iECKO; ApoE-/- mice; n=9 PlxnD1fl/fl; ApoE-/- and 8 PlxnD1iECKO; ApoE-/-. The data represent mean±SEM. P-values were obtained by performing two-tailed Student's t test using Graphpad Prism *p<0.05, **p<0.01, ****p<0.0001

