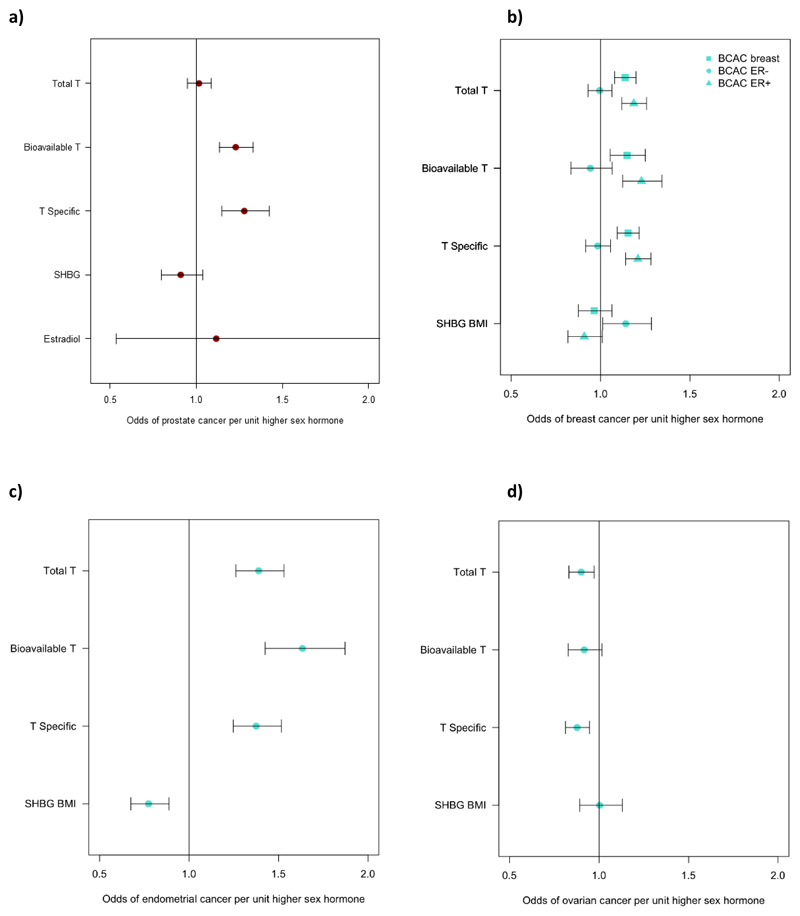
Extended Data Fig. 6. Results of inverse-variance weighted Mendelian randomization analysis of sex hormone genetic instruments on cancer outcomes.
Dot plots representing the change in the odds of the following cancers per unit higher sex hormone in males or females, as appropriate. a) Prostate cancer in males. b) Breast cancer (all types) and estrogen receptor positive (ER+) and negative (ER-) subtypes in females. c) Endometrial cancer in females. d) Ovarian cancer in females. Bars indicate 95% confidence interval around the point estimate from inverse-variance weighted analyses. Analyses are based on association statistics generated in a maximum of: total and specific testosterone, n=194,453 men and n=230,454 women; bioavailable testosterone, n=178,782 men and n=188,507 women; SHBG, n=180,726 men and n=189,473 women; estradiol, n=206,927 men; prostate cancer, 67,158 cases and 48,350 controls; breast cancer, n=105,974 cases and n=122,977 controls; ER negative subtype breast cancer, n=21,468 cases and n=100,594 controls; ER positive subtype breast cancer, n=69,501 cases and n=95,039 controls; endometrial cancer, n=12,270 cases and n=46,126 controls; ovarian cancer, n=25,509 cases and n=40,941 controls. Numbers of genetic variants included in the analyses are given in Tables S25 and S27. SHBG=sex hormone binding globulin; T=testosterone; T Specific=testosterone cluster.

