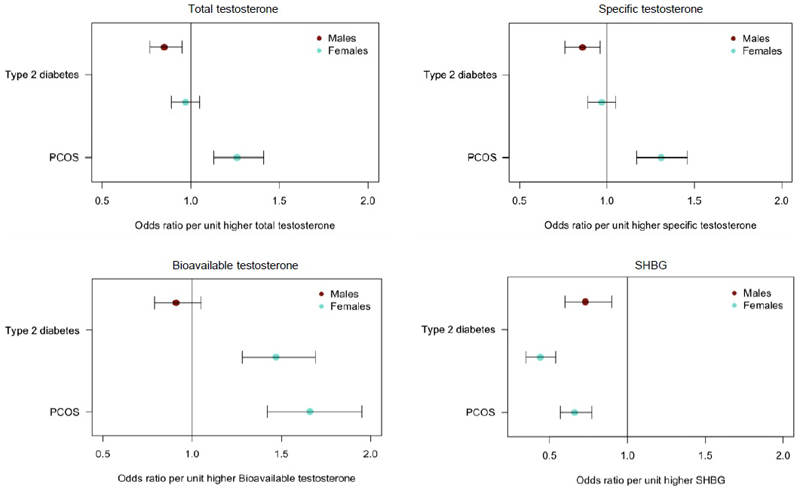
Figure 3.
Plots showing the odds of T2D and PCOS per unit higher testosterone and SHBG using genetic instruments in Mendelian Randomization analyses. Unit measurements for the individually transformed exposure traits can be found in Table S1. Specific testosterone refers to a total testosterone score which has no aggregate effect on SHBG. Bars indicate 95% confidence interval around the point estimates from inverse-variance weighted analyses. Analyses are based on association statistics generated in a maximum of: total and specific testosterone, n=194,453 men and n=230,454 women; bioavailable testosterone, n=178,782 men and n=188,507 women; SHBG, n=180,726 men and n=189,473 women; T2D, n=34,990 cases and n=150,760 controls in men and n=17,790 cases and n=243,645 controls in women; PCOS, n=10,074 cases and n=103,164 controls. Numbers of genetic variants included in the analyses are given in Tables S20 and S21.

