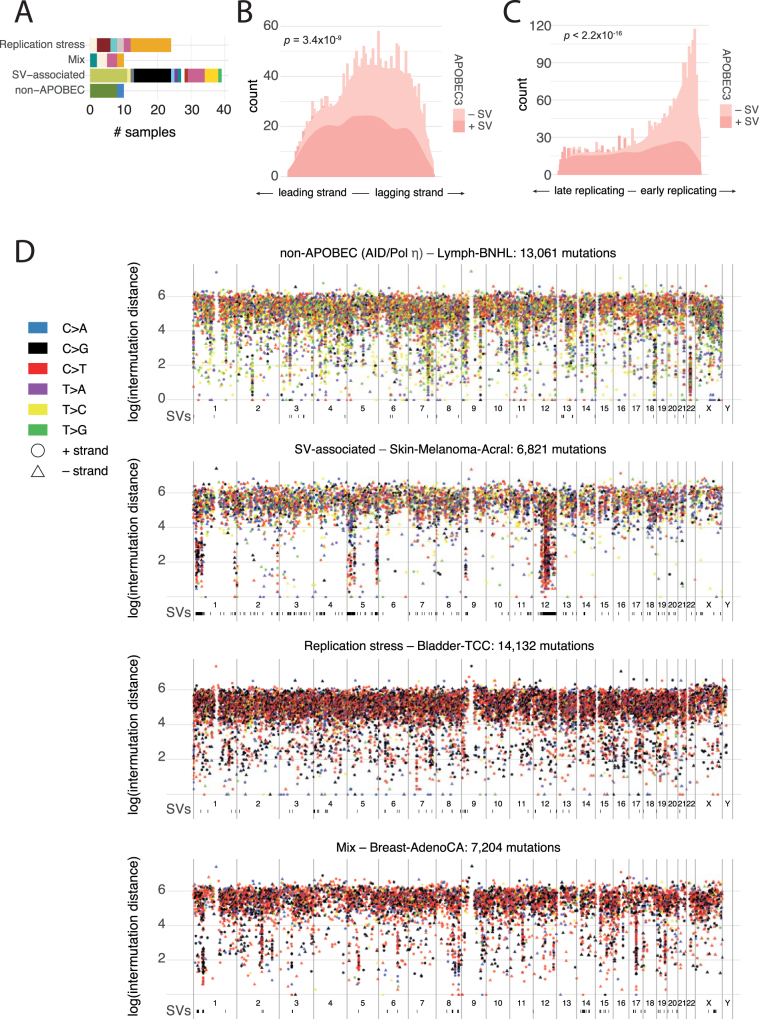
Extended Data Fig. 6. Patterns of intense kataegis.
a, Distribution of the tumour types (colour-coded as in Extended Data Fig. 3) of the samples in the top 5% of kataegis intensity in each of the four identified genome-wide patterns: non-APOBEC, replication stress, rearrangement-associated and the combination of the last two. b, c, Distribution of leading/lagging strand (b) and replication timing bias (c) for rearrangement-(in)dependent APOBEC kataegis, based on n = 2,583 tumours. P values were derived using a two-sided Mann–Whittney U-test. d, Example rainfall plots for each of the four identified kataegis patterns.

