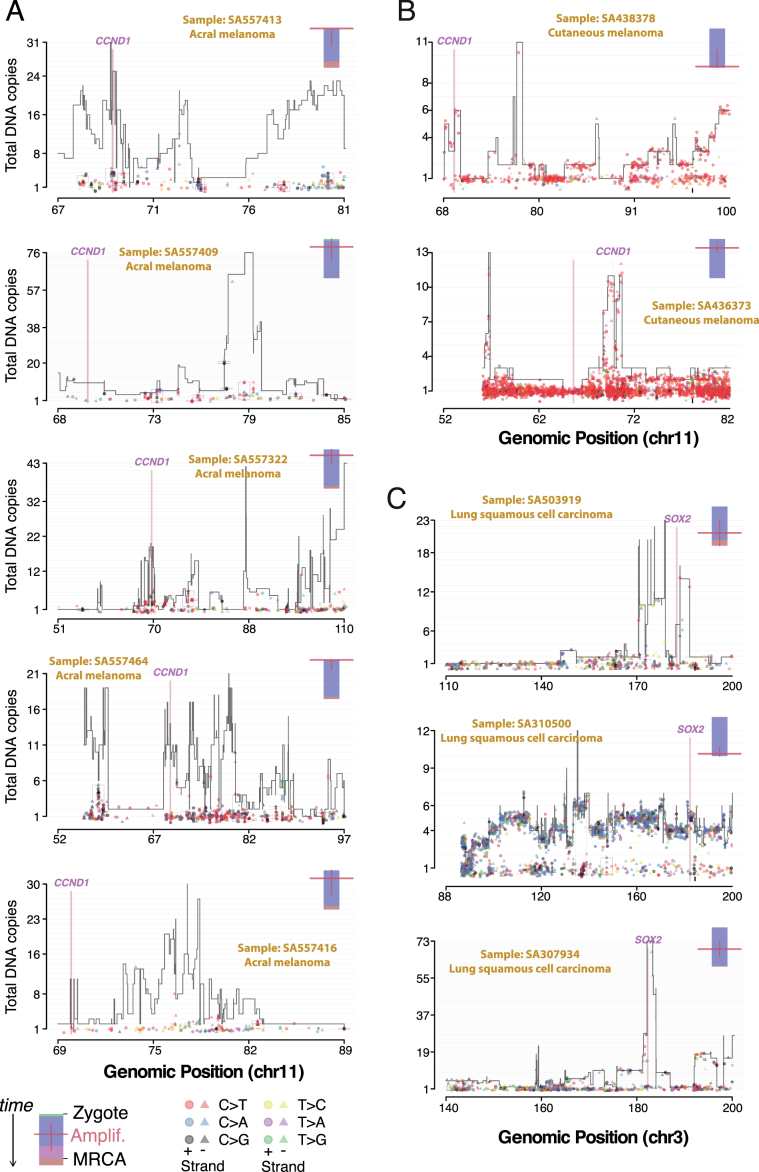
Extended Data Fig. 9. Timing the amplifications after chromothripsis in molecular time for 10 representative cases.
a, Copy-number plot of chromothriptic regions categorized as ‘liposarc-like’ in five acral melanomas with CCND1 amplification. Segments indicate the copy number of the major allele. Points represent SNV multiplicities, that is, the estimated number of copies carrying each SNV, coloured by base change and shaped by strand. Small vertical arrows link SNVs to their corresponding copy-number segment. Kataegis foci are shown within black boxes and show typical strand specificities (all triangles or all circles), similar multiplicities and base changes of signatures 2 and 13 (red and black, respectively). A coloured bar (top right) represents the molecular timing of the amplification (red bar; high is early, low is late) and is coloured by the fraction of total SNVs assigned to the following timing categories: clonal [early], clonal mutations that occurred before duplications involving the relevant chromosome (including whole-genome duplications); clonal [late], clonal mutations that occurred after such duplications; and clonal [NA], mutations that occurred when no duplication was observed. b, Same as a in two cutaneous melanomas, one shows early amplification, the other late amplification. c, Same as a, b, for three lung squamous cell carcinomas and late amplification of SOX2.

