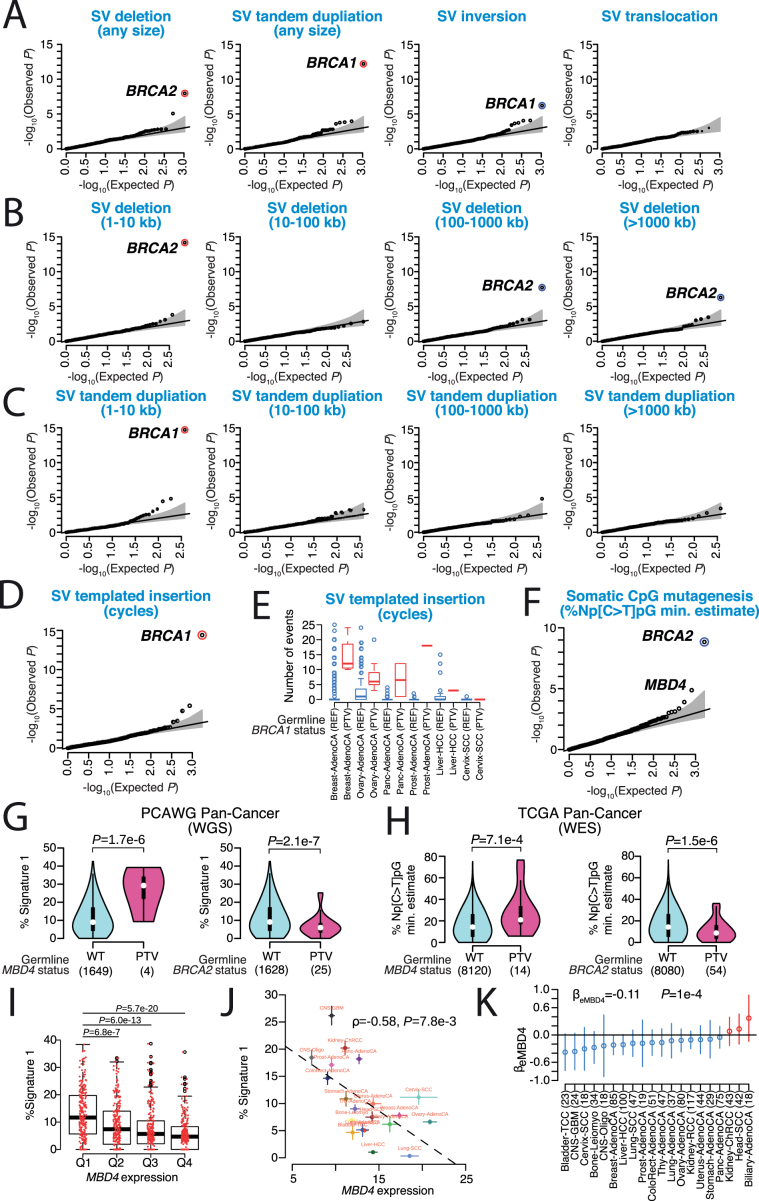
Extended Data Fig. 11. Association between rare germline PTVs in protein-coding genes and somatic mutational phenotypes.
a–d, f, Data are based on two-sided rare-variant association testing across n = 2,583 patients, with a stringent P value threshold of P < 2.5 × 10⁻⁶ used to mitigate multiple-hypothesis testing (significant genes marked with coloured circles). Blue/red circles mark genes that decrease/increase somatic mutation rates. The black line represents the identity line that would be followed if the observed P values followed the null expectation, with the shaded area showing the 95% confidence intervals. a, QQ plots for the proportion of somatic SV deletions, tandem duplications, inversions and translocation in cancer genomes. b, QQ plots for the proportion of somatic SV deletions in cancer genomes stratified by four size groups (1–10 kb, 10–100 kb, 100–1,000 kb and >1,000 kb). c, QQ plots for the proportion of somatic SV tandem duplications in cancer genomes stratified by four size groups (1–10 kb, 10–100 kb, 100–1,000 kb and >1,000 kb). d, QQ plot for the presence or absence of somatic SV templated insertion (cycles) in cancer genomes. e, Number of SV-templated insertion cycles in PCAWG tumours with germline BRCA1 PTVs. Only histological samples with at least one germline BRCA1 PTV carrier are shown (n = 1,095 patients combined). The box denotes the interquartile range, with the median marked as a horizontal line. The whiskers extend as far as the range or 1.5× the interquartile range, whichever is less. Outliers are shown as points. f, QQ plot for somatic CpG mutagenesis in cancer genomes based on NpCpG motif analysis. g, Violin plots show estimated densities of the proportion of somatic CpG mutations in PCAWG donors with germline MBD4 and BRCA2 PTVs. The box denotes the interquartile range, with the median marked as a white point. The whiskers extend as far as the range or 1.5× the interquartile range, whichever is less. Two-sided hypothesis testing, not corrected for multiple testing, was performed using linear regression models. h, Replication of germline MBD4 and BRCA2 PTV associations with somatic CpG mutagenesis in TCGA whole-exome sequencing donors. Violin plots show the estimated density of the proportion of somatic CpG mutations in TCGA exomes with germline MBD4 and BRCA2 PTVs. The box denotes the interquartile range, with the median marked as a white point. The whiskers extend as far as the range or 1.5× the interquartile range, whichever is less. Two-sided hypothesis testing, not corrected for multiple testing, was performed using linear-regression models. i, Correlation between MBD4 expression and somatic CpG mutagenesis in primary solid PCAWG tumours. Hypothesis testing was two-sided and not corrected for multiple testing, using linear-regression models. The box denotes the interquartile range, with the median marked as a horizontal line. The whiskers extend as far as the range or 1.5× the interquartile range, whichever is less. j, Data are mean ± s.e.m. across n = 20 tumour types. The dashed black line shows the fitted line to the data, estimated using linear-regression models. Hypothesis testing was two-sided and not corrected for multiple testing, using Spearman’s rank correlations. k, MBD4 effect sizes (open circles) with 95% confidence intervals (error bars) for individual cancer types were estimated using linear-regression analysis after (if available) accounting for sex, age at diagnosis (young/old) and ICGC project. Hypothesis testing was two-sided and not corrected for multiple testing.

