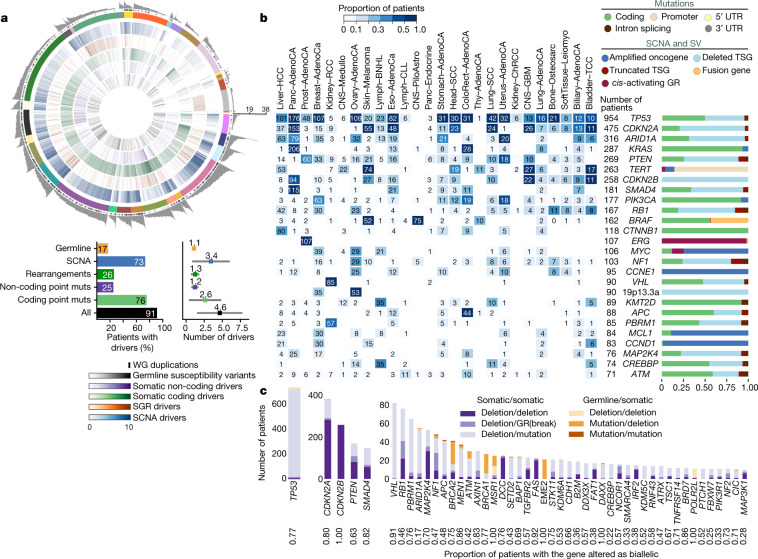
Fig. 2. Panorama of driver mutations in PCAWG.
a, Top, putative driver mutations in PCAWG, represented as a circos plot. Each sector represents a tumour in the cohort. From the periphery to the centre of the plot the concentric rings represent: (1) the total number of driver alterations; (2) the presence of whole-genome (WG) duplication; (3) the tumour type; (4) the number of driver CNAs; (5) the number of driver genomic rearrangements; (6) driver coding point mutations; (7) driver non-coding point mutations; and (8) pathogenic germline variants. Bottom, snapshots of the panorama of driver mutations. The horizontal bar plot (left) represents the proportion of patients with different types of drivers. The dot plot (right) represents the mean number of each type of driver mutation across tumours with at least one event (the square dot) and the standard deviation (grey whiskers), based on n = 2,583 patients. b, Genomic elements targeted by different types of mutations in the cohort altered in more than 65 tumours. Both germline and somatic variants are included. Left, the heat map shows the recurrence of alterations across cancer types. The colour indicates the proportion of mutated tumours and the number indicates the absolute count of mutated tumours. Right, the proportion of each type of alteration that affects each genomic element. c, Tumour-suppressor genes with biallelic inactivation in 10 or more patients. The values included under the gene labels represent the proportions of patients who have biallelic mutations in the gene out of all patients with a somatic mutation in that gene. GR, genomic rearrangement; SCNA, somatic copy-number alteration; SGR, somatic genome rearrangement; TSG, tumour suppressor gene; UTR, untranslated region.

