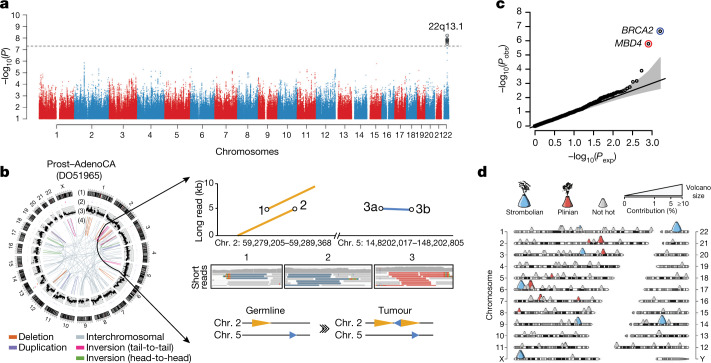
Fig. 6. Germline determinants of the somatic mutation landscape.
a, Association between common (MAF > 5%) germline variants and somatic APOBEC3B-like mutagenesis in individuals of European ancestry (n = 1,201). Two-sided hypothesis testing was performed with PLINK v.1.9. To mitigate multiple-hypothesis testing, the significance threshold was set to genome-wide significance (P < 5 × 10⁻⁸). b, Templated insertion SVs in a BRCA1-associated prostate cancer. Left, chromosome bands (1); SVs ≤ 10 megabases (Mb) (2); 1-kb read depth corrected to copy number 0–6 (3); inter- and intrachromosomal SVs > 10 Mb (4). Right, a complex somatic SV composed of a 2.2-kb tandem duplication on chromosome 2 together with a 232-base-pair (bp) inverted templated insertion SV that is derived from chromosome 5 and inserted inbetween the tandem duplication (bottom). Consensus sequence alignment of locally assembled Oxford Nanopore Technologies long sequencing reads to chromosomes 2 and 5 of the human reference genome (top). Breakpoints are circled and marked as 1 (beginning of tandem duplication), 2 (end of tandem duplication) or 3 (inverted templated insertion). For each breakpoint, the middle panel shows Illumina short reads at SV breakpoints. c, Association between rare germline PTVs (MAF < 0.5%) and somatic CpG mutagenesis (approximately with signature 1) in individuals of European ancestry (n = 1,201). Genes highlighted in blue or red were associated with lower or higher somatic mutation rates. Two-sided hypothesis testing was performed using linear-regression models with sex, age at diagnosis and cancer project as variables. To mitigate multiple-hypothesis testing, the significance threshold was set to exome-wide significance (P < 2.5 × 10⁻⁶). The black line represents the identity line that would be followed if the observed P values followed the null expectation; the shaded area shows the 95% confidence intervals. d, Catalogue of polymorphic germline L1 source elements that are active in cancer. The chromosomal map shows germline source L1 elements as volcano symbols. Each volcano is colour-coded according to the type of source L1 activity. The contribution of each source locus (expressed as a percentage) to the total number of transductions identified in PCAWG tumours is represented as a gradient of volcano size, with top contributing elements exhibiting larger sizes.

