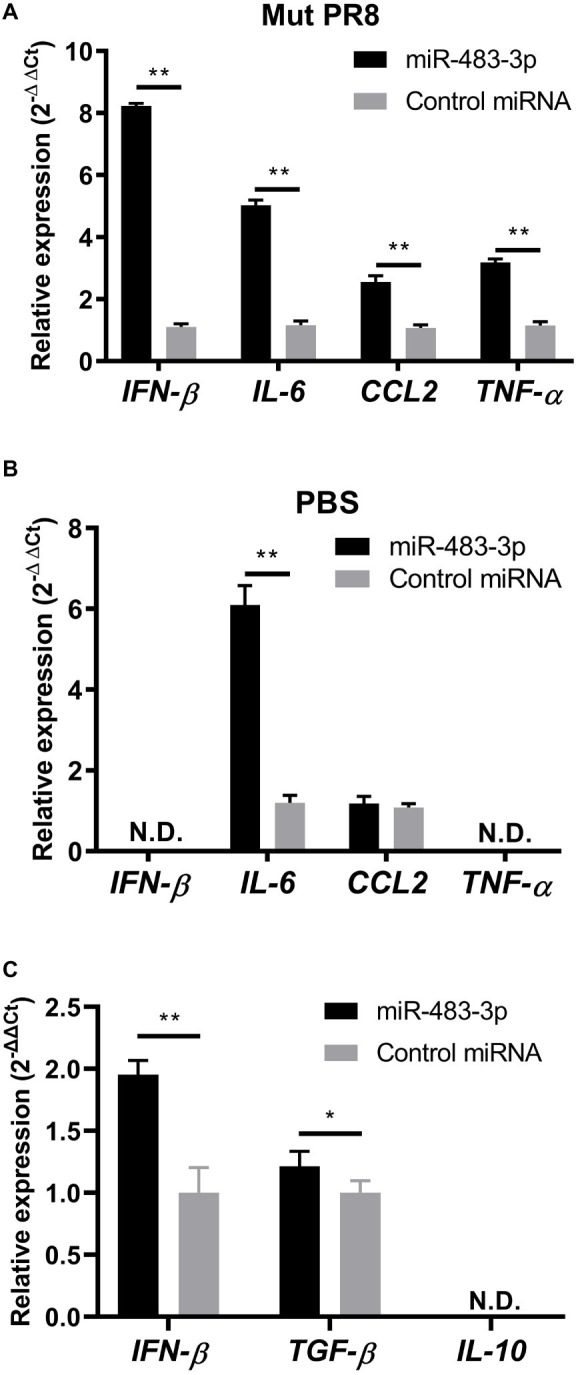
Figure 2.

Proinflammatory and anti-inflammatory cytokine gene expression in MS1 cells upon miR-483-3p treatment. miRNA mimic treated MS1 cells were (A) infected with Mut-PR8 at an MOI of 0.2, or (B) treated with PBS for 12 h. The cells were then lysed and total RNA was isolated. IFN-β, IL-6, CCL2, and TNF-α gene expression was quantified by qRT-PCR. (C) miRNA mimic-treated MS1 cells were infected with Mut-PR8 at an MOI of 0.2 for 12 h. The cells were then lysed and total RNA was isolated. IFN-β, TGF-β, and IL-10 gene expression was quantified by qRT-PCR. Results are presented relative to the control miRNA-transfected cell levels (2−ΔΔCt). Statistical analysis was performed by using Student’s t-test. **p < 0.01, *p < 0.05. There were (A,B) three technical replicates and (C) five technical replicates. qRT-PCR was carried out on (A,B) an ABI 7900HT Fast Real-Time System, or (C) a QuantStudio™ 6 Flex Real-Time PCR System. Data are presented as the mean ± SD.
