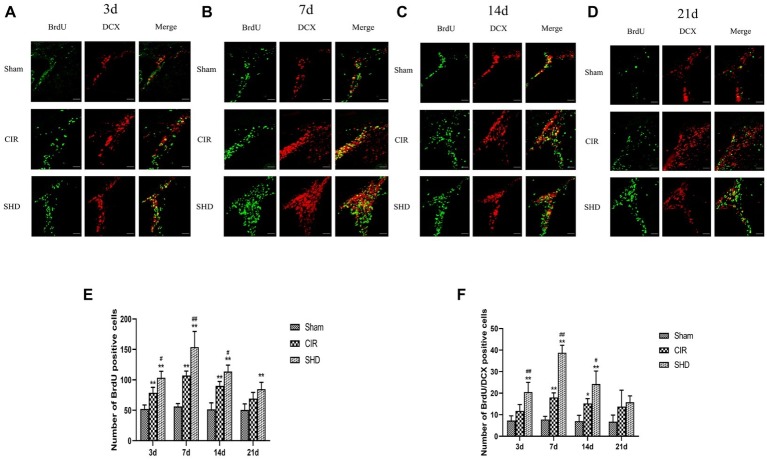
Figure 3.
Immunofluorescence staining of BrdU positive and BrdU/DCX positive cells in the subventricular zone (SVZ) of the Sham, CIR and SHD groups at 3 d (A), 7 d (B), 14 d (C), and 21 d (D) after reperfusion (n = 6; scale bar = 100 μm). (E) The bar graph of the number of BrdU positive cells. (F) The bar graph of the number of BrdU/DCX positive cells. *p < 0.05, **p < 0.01, compared to the Sham group; #p < 0.05, ##p < 0.01, compared to the CIR group.

