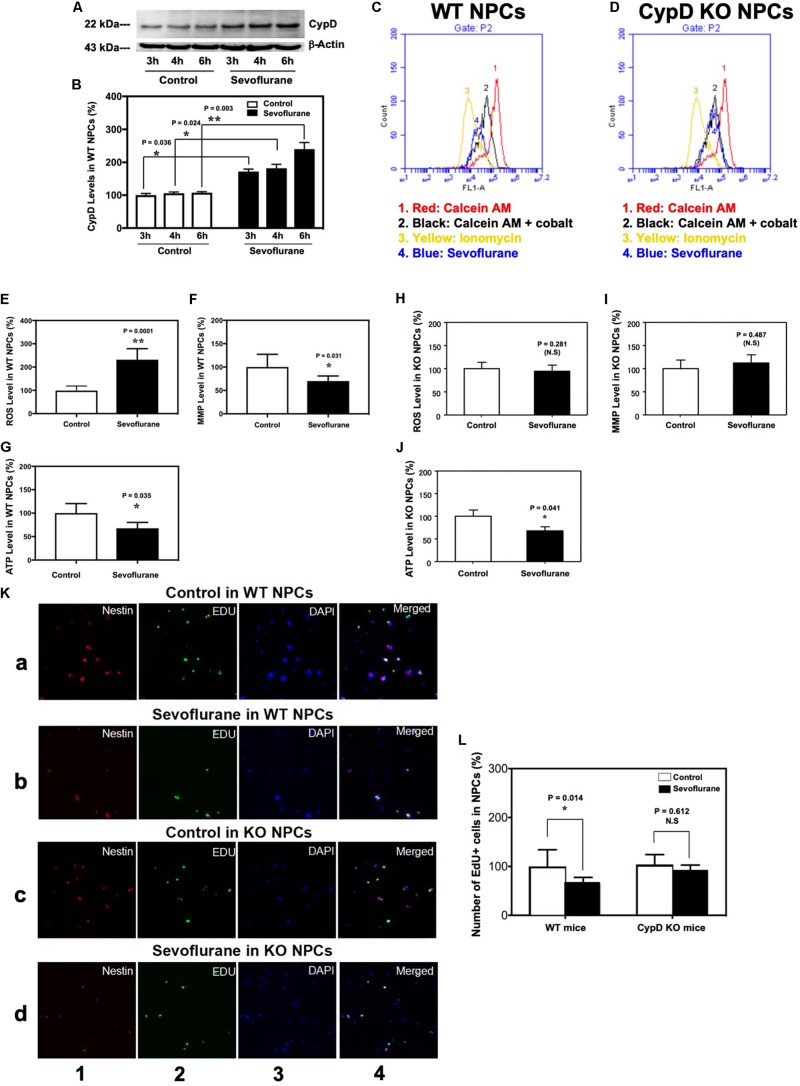
FIGURE 5.
Sevoflurane induces a CypD-dependent mitochondrial dysfunction and impairment of neurogenesis in NPCs. (A) Western blot shows a time-dependent increase of CypD levels after sevoflurane anesthesia as compared to the control condition in the WT NPCs. There is no significant difference in the amount of β-actin in each group. (B) Quantification of the Western blot shows that sevoflurane anesthesia (black bar) increases CypD levels as compared to the control condition in the WT NPCs (white bar). (*P = 0.036, *P = 0.024, and **P = 0.003, Student’s t test with post hoc Bonferroni adjustment, N = 6). (C) Flow cytometric analysis shows changes in the calcein levels in mitochondria of WT NPCs, which indicates the opening of mPTP: peak 1, calcein AM-treated NPCs; peak 2, negative control (treatment of calcein AM plus cobalt); peak 3, positive control (treatment of calcein AM plus cobalt and ionomycin); peak 4, calcein AM plus cobalt and sevoflurane. The changes in the intensity of fluorescence between sevoflurane anesthesia (peak 4), positive control (peak 3), and negative control (peak 2) suggest that sevoflurane induces opening of mPTP. (D) Flow cytometric analysis shows changes in the calcein levels in mitochondria of CypD KO NPCs, which indicates that sevoflurane does not induce the opening of mPTP. (E) Sevoflurane anesthesia (black bar) increases ROS levels as compared to the control condition (white bar) in WT NPCs. (**P = 0.0001, Student’s t test, N = 6). (F) Sevoflurane anesthesia (black bar) reduces levels of MMP as compared to the control condition in WT NPCs (*P = 0.031, Student’s t test, N = 6). (G) Sevoflurane (black bar) decreases ATP levels as compared to the control condition (white bar) in WT NPCs. (*P = 0.035, Student’s t test, N = 6). (H) Sevoflurane anesthesia does not significantly affect the ROS levels in CypD KO NPCs. (I) Sevoflurane anesthesia does not significantly affect the MMP levels in CypD KO NPCs. (J) Sevoflurane anesthesia (black bar) decreases ATP levels as compared to the control condition (white bar) in the CypD KO NPCs. (*P = 0.041, Student’s t test, N = 6). (K) Immunocytochemistry image shows that the sevoflurane anesthesia (row b) decreases the number of EdU-positive and EdU/Nestin-positive cells as compared to the control condition (row a) in WT NPCs. However, sevoflurane anesthesia (row d) does not significantly change the number of EdU-positive cells and EdU/Nestin-positive cells as compared to control condition (row c) in the CypD KO NPCs. Column 1 is the image of Nestin staining (red), the marker of NPCs; column 2 is EdU staining (green), the marker of proliferated cells; column 3 is nuclei staining (blue), and column 4 is the merged image. The purple color in column 4 indicates the proliferated NPCs. (L) Flow cytometric analysis shows that the sevoflurane anesthesia decreases the number of EdU-positive cells as compared to the control condition (white bar) in the WT NPCs (*P = 0.014, Student’s t test, N = 3), but not in the CypD KO NPCs (P = 0.612, Student’s t test, N = 3). N.S., not significant.

