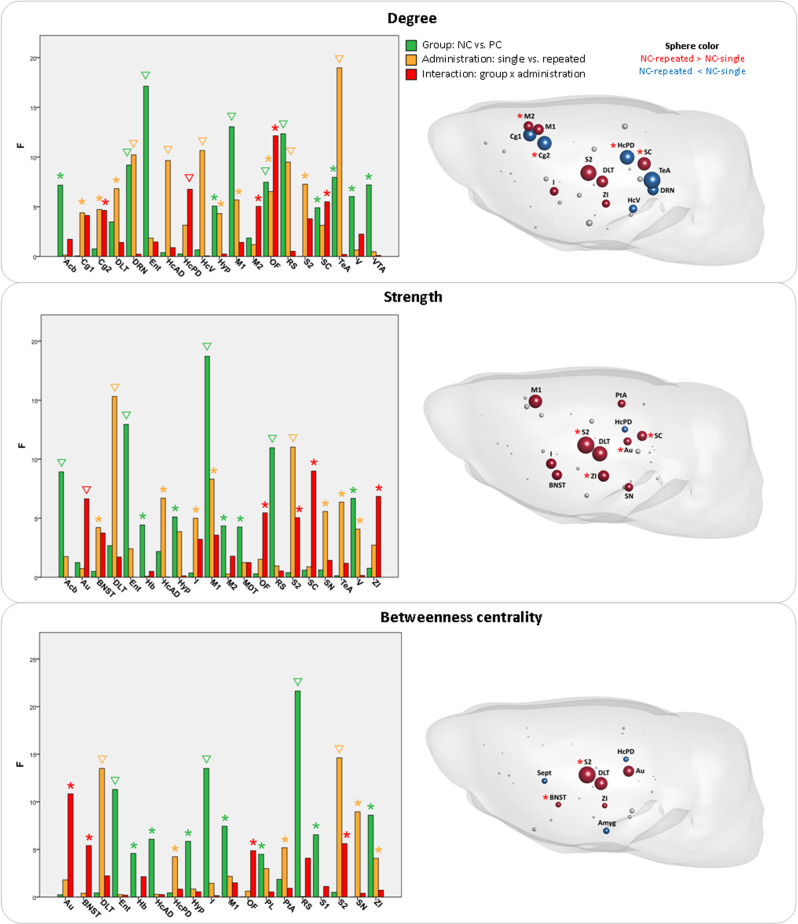
Fig. 3. Ketamine effects on graph analytical local properties: degree, strength, and betweenness centrality.
Left: The vertical bars represent F-statistic values from two-way ANOVA test with effects of group (green), type of ketamine administration (yellow), and interaction between group and administration (red). Asterisks (*) denote significant results (p < 0.05), triangles (∇) signify results surviving false discovery rate correction (correction for number of brain regions N = 43, q < 0.05). Right: Comparison between repeated and single administration of ketamine in the NC group, illustrating regions with significant effects of interaction (red asterisk) from two-way ANOVA, as shown on the left panel. The regions without asterisk were significantly different in the post hoc tests (p < 0.05), but had no differences for the interaction in two-way ANOVA. Several regions had significant results in interaction, but no difference between the type of administration in the NC rats in post hoc tests. Sphere size represents the –log(p) values from the post hoc tests, sphere color signifies the direction of the effect (red: repeated > single; blue: repeated < single). Acb nucleus accumbens, Amyg amygdala, Au auditory cortex, BNST bed nucleus of stria terminalis, Cg1 cingulate cortex area 1, Cg2 cingulate cortex area 2, DLT dorsolateral thalamus, DRN dorsal raphe nuclei, Ent entorhinal cortex, Hb habenula, HcAD antero-dorsal hippocampus, HcPD postero-dorsal hippocampus, HcV ventral hippocampus, Hyp hypothalamus, I insular cortex, M1 primary motor cortex, M2 secondary motor cortex, OF orbitofrontal cortex, PL prelimbic cortex, PtA parietal association cortex, RS retrosplenial cortex, S1 primary somatosensory cortex, S2 secondary somatosensory cortex, SC superior colliculus, Sept septal area, SN substantia nigra, TeA temporal association cortex, V visual cortex, VTA ventral tegmental area, ZI zona incerta.

