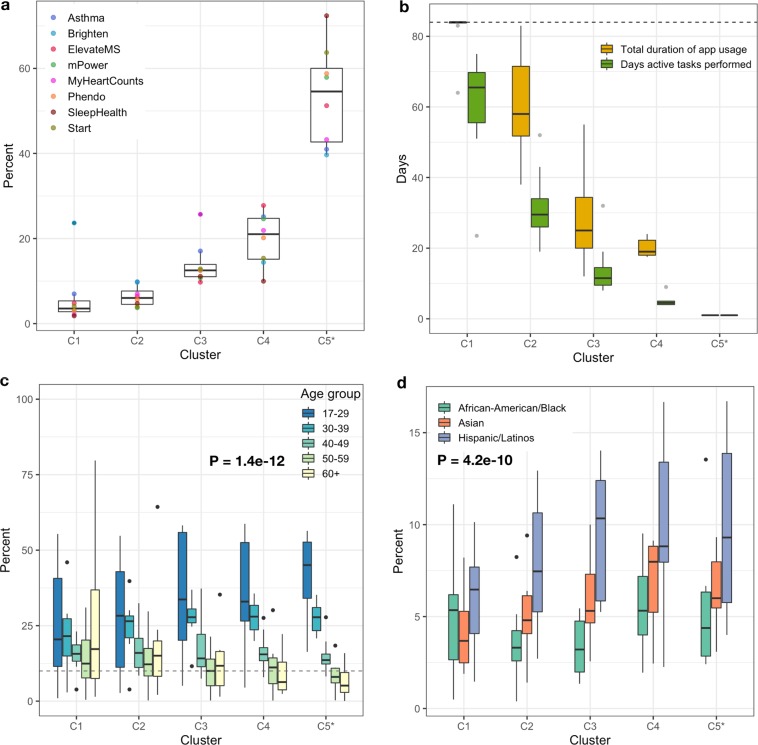
Fig. 4. Comparison of characteristics across participant engagement clusters.
a Proportion of participants in each cluster across the study apps, b Participants total app usage duration(between 1–84 days) and the number of days participants completed tasks in the study apps, c Significant differences [F(4,163) = 18.5, P = 1.4e-12] in the age groups of participants across five clusters and d Significant differences [F(2,81) = 28.5, P = 4.1e-10] in proportion of minority population present in the five clusters. C5* cluster contains the participants that used the apps for less than a week and were removed from the clustering; however, they were added back for accurate proportional comparison of participants in each cluster. The centerline of the boxplots shows the median value across the studies for each cluster and upper and lower whisker corresponds to the outlier point that is at least 1.5 times the interquartile range.

