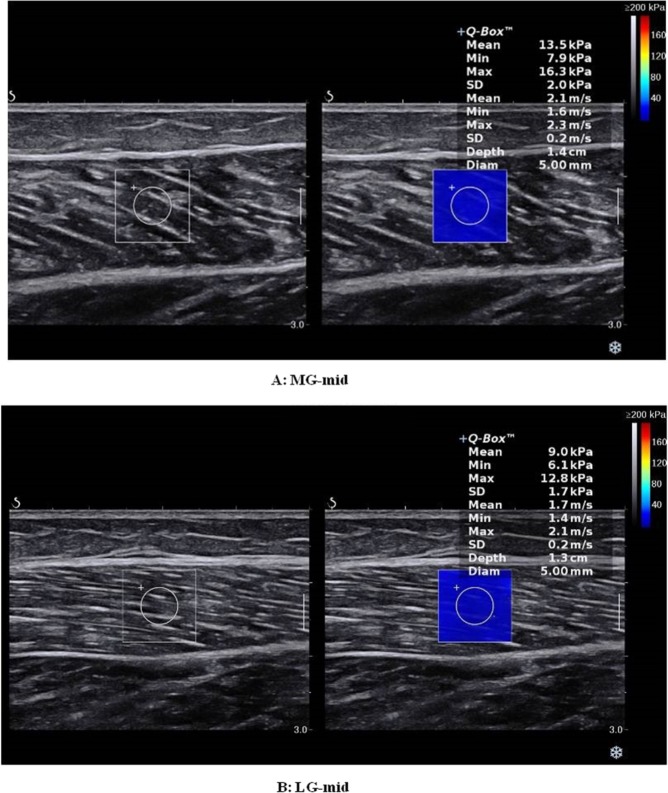
Figure 1.
Longitudinal shear wave elastography scale sonograms of the MG and LG show the measurement of the shear modulus. The color-coded box indicating muscle-tendon elasticity is shown in the upper images. The longitudinal grey-scale sonograms of muscle-tendon are shown in the bottom images. The Q-BoxTM is shown on the right. (A) Shear modulus values of the MG with the ankle joint in the relaxed position. (B) Shear modulus values of the LG with the ankle joint the relaxed position.

