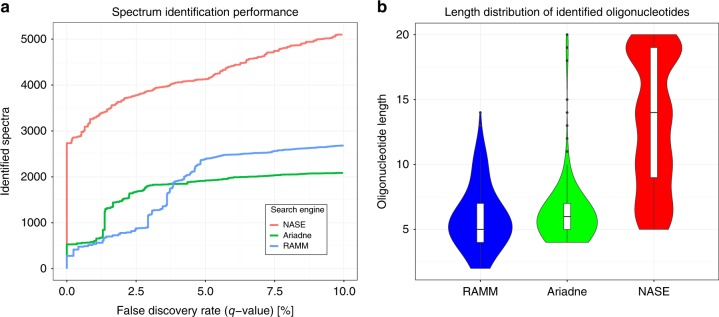
Fig. 2. Performance comparison of RNA identification engines—Ariadne, RNAModMapper (RAMM) and NucleicAcidSearchEngine (NASE)—based on searches of the NME1 data.
a Number of successfully identified spectra plotted against the q-value, a measure of the false-discovery rate, which was calculated from a target/decoy database search using each of the three tools. b Sequence length distribution of identified oligonucleotides for each tool at a confidence level of 5% FDR, shown using violin and box plots. Box plot center lines indicate data medians, box limits show upper and lower quartiles, whiskers extend to the largest/smallest value no further than 1.5 times the interquartile range from the box, black dots represent outliers.

