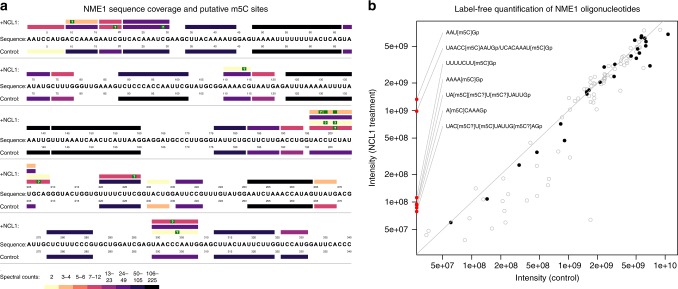
Fig. 3. Comparison of the NME1 control and NCL1-treated sample based on NASE search results at 1% FDR, without “single hits”.
a Coverage plot showing oligonucleotides identified in the respective sample above/below the NME1 RNA sequence. Bars representing oligonucleotides are colored according to their number of spectral matches (spectral counts). Oligonucleotide identifications supported by higher spectral counts (darker colors) are considered more reliable. Putative 5-methylcytidine (m5C) modification sites are marked in green. Sites with a “?”, the one-letter code for m5C, were uniquely localized; “blank” sites indicate uncertainty between two possible locations, due to the absence of discriminating peaks in the corresponding mass spectrum. b Label-free quantification results for identified oligonucleotides, comparing feature-based signal intensities in the two samples (averaged across replicates). Gray circles show all individual charge/adduct states, while black dots indicate the “best” representative (lowest coefficient of variation across replicates) for quantifying each oligonucleotide. Oligonucleotides that were only identified and quantified in the NCL1-treated sample, all of them methylated, are depicted on the y axis. The notation “[m5C?]” is used here for cases where the methylation could not be uniquely localized. No modified oligonucleotides were identified in the control sample. The gray diagonal line represents equal intensity in both samples.

