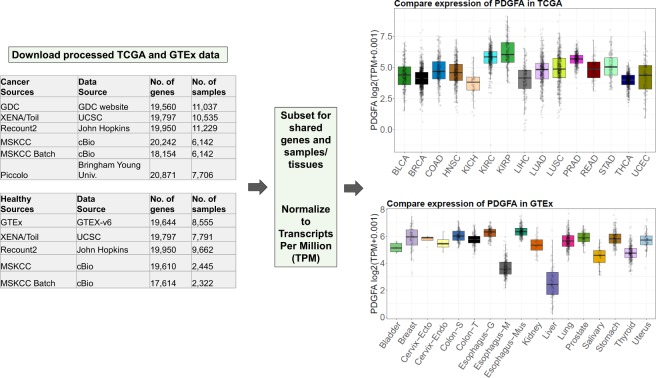
Figure 1.
Overview of the data analyzed, showing how data were normalized to allow comparisons among data sets, and example expression data for one gene from GDC and GTEx (v6). Tables show number of genes and samples available from each data source for TCGA and GTEx, Boxplots represent log2(TPM +0.001) values for gene PDGFA for different types of cancer in TCGA and different regions in GTEx. (Abbreviations expanded in Supplementary Table S1c).

