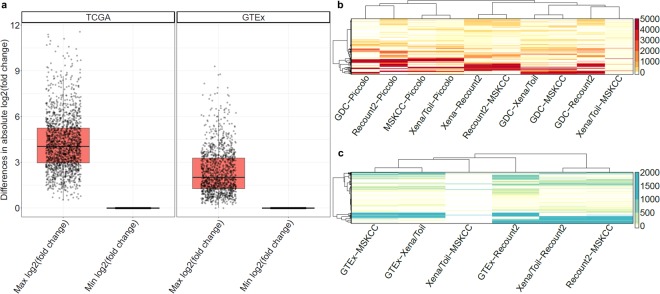
Figure 4.
Summaries of fold-change and abundance estimate differences among RNA-seq pipelines. (a) Large inter-pipeline differences in fold change estimates for the same sample pairs among discordant genes. Shown are the maximum and minimum fold-difference estimates among pipelines for each discordant gene across all sample pairs. Heatmaps showing the number of discordant samples per gene in TCGA (b) and GTEx (c) data. Each row represents one discordant gene, each column represents a comparison between two pipelines (as labeled).

