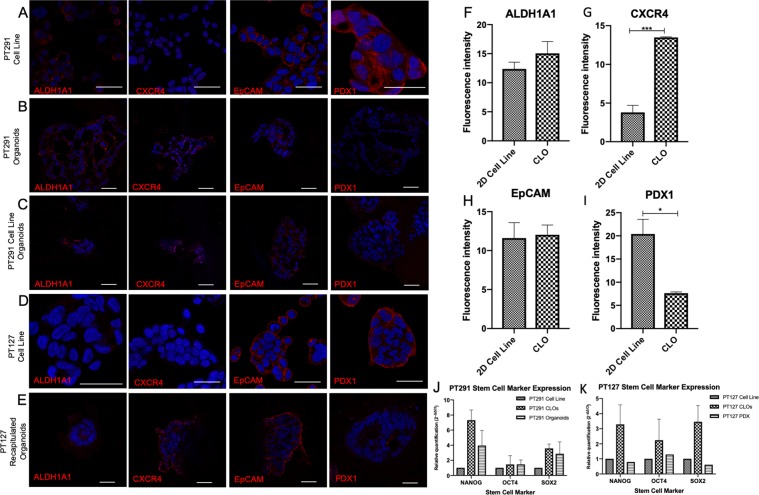
Figure 4.
Confocal images of immunofluorescence staining images of ALDH1A1, CXCR4, EpCAM, and PDX1 (red) scale bars 40 μm in (A) PT291 2D primary cell line (B) PT291 organoids (C) PT291 CLO (D) PT127 2D primary cell line and (E) PT127 CLO. DAPI counterstain (blue). Images are representative of three independent experiments. (F–I) Analysis comparing the fluorescence intensity between PT291 CLOs and 2D cell lines in (F) ALDH1A1 (G) CXCR5 (H) EpCAM and (I) PDX1. (J,K) Relative quantification of stem cell markers NANOG, OCT4 and SOX2 assessed using qRT-PCR in (J) PT291 PDX derived cell line, organoids and CLOs, and (K) PT127 PDX derived cell line, CLOs and PDX tumour sample. Expression is shown relative to the expression in matched cell line. 18 S rRNA used as endogenous control n = 3.

