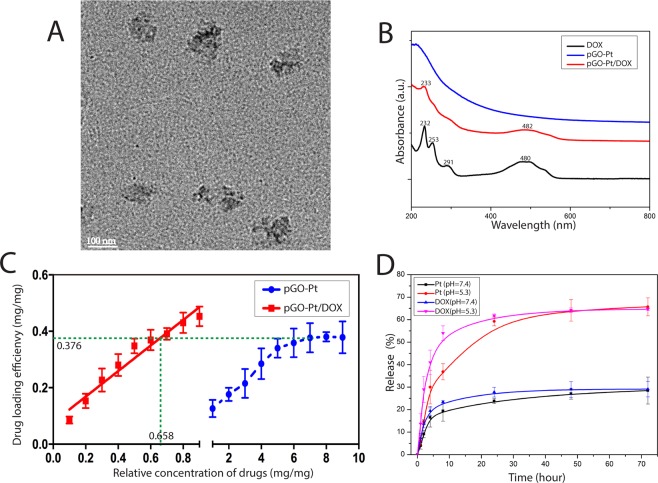
Figure 3.
Characterization of pGO-Pt/DOX nanoparticles. (A) TEM image of pGO-Pt/DOX. (B)UV-Vis spectra of pGO-Pt/DOX, pGO-Pt, Pt and DOX. (C) The drug loading efficiency (DLE) of pGO-Pt/DOX, the saturated DLE of Pt was at around 0.376 mg/mg. we managed to optimize the finally weight ratio of DOX: PT: pGO = 0.376: 0.376: 1. Thereby, the DLE of DOX reached to 0.376 mg/mg when the initial concentration was 0.658 mg/mL (the including-pGO concentration of 1.0 mg/mL). (D) The release profile of Pt and DOX from pGO-Pt/DOX in buffers at pH 5.3 and 7.4.

