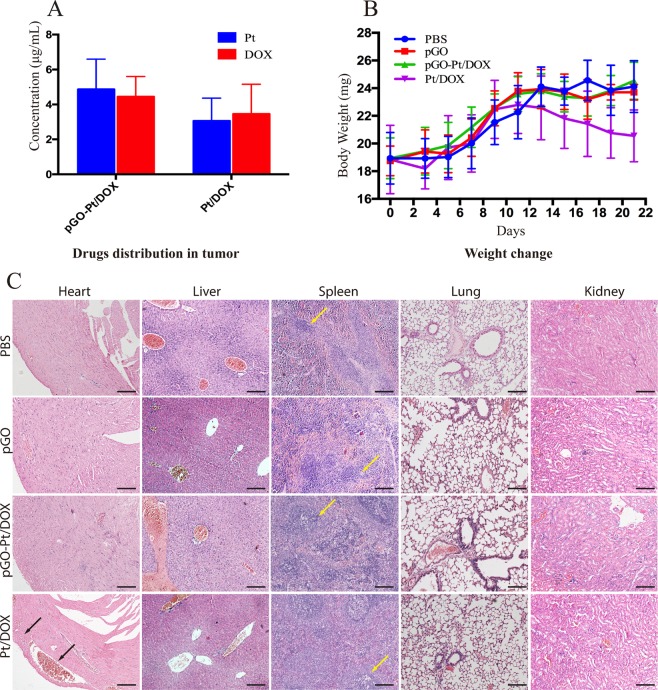
Figure 6.
(A) Quantification analysis of both Pt and DOX amounts in tumor after 12 h post-injection of pGO-Pt/DOX and Pt/DOX mixture, respectively. Bars, mean ± SD (n = 6). (B) Body weight curves after treatment with PBS, pGO, pGO-Pt/DOX, and Pt/DOX mixture, respectively. Bars, mean ± SD (n = 6). (C) H&E staining images of major organs (heart, liver, spleen, lung and kidney) after different treatments. Black arrows represent myocardial congestion and cardiomyocyte hypertrophy. Yellow arrows represent splenic nodule. Scale bar: 100 μm.

