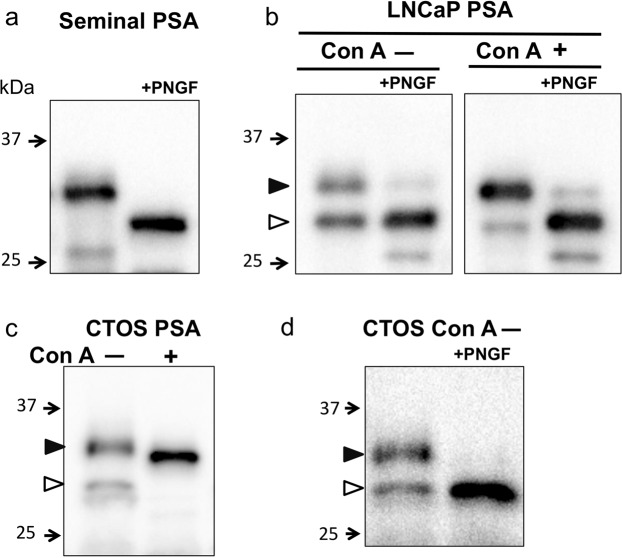
Figure 3.
Western blot analysis of PSA from seminal plasma and cancer cells. (a) Seminal PSA with and without PNGF treatment. (b) PSA from LNCaP in Con A (−) and (+) fraction with and without PNGF treatment. (c) Immunoprecipitated PSA in Con A (−) and (+ fraction from CTOS. (d) Immunoprecipitated PSA in Con A (−) fraction from CTOS with and without PNGF treatment. The position of each high molecular and low molecular PSA was indicated by closed and open triangle, respectively. Full-length blots are presented in Supplementary Fig. S4.

