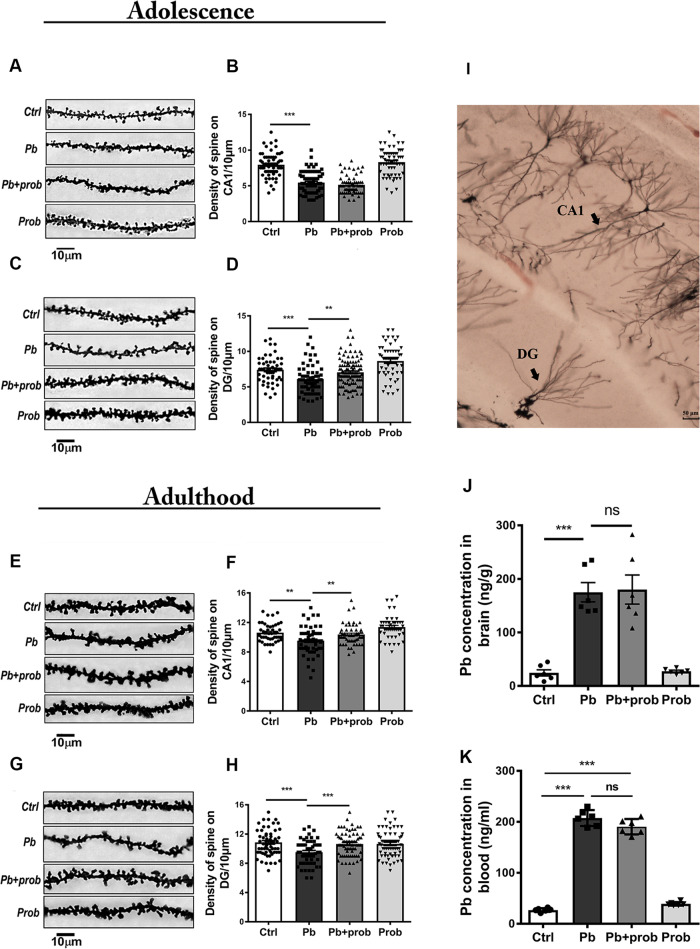
Fig. 2. Probiotics rescued the morphological abnormalities of dendritic spines.
At adolescence (PND 22), representative images (~50 cells, n = 6) and quantification of spine densities are shown in the region of CA1 (a, b) and DG (c, d). Each point in the graph represents a single cell subjected to analysis. At adulthood (PND 68), representative images and quantification of spine densities are shown in the region of CA1 (e, f) and DG (g, h). To manifest the tested hippocampal regions, typical morphologies of neurons in the regions of CA1 and DG are presented in the overall perspective (i). The scale bar represents 50 μm. j, k Lead concentration in the rat brains (j) and blood (k) of each group (n = 6). Ctrl non-treated rats, Pb lead-treated rats, Pb+prob lead and probiotics-treated rats, prob probiotics-treated rats. The data are represented as mean ± SEM; ***p < 0.001, **p < 0.01, NS p > 0.05.

