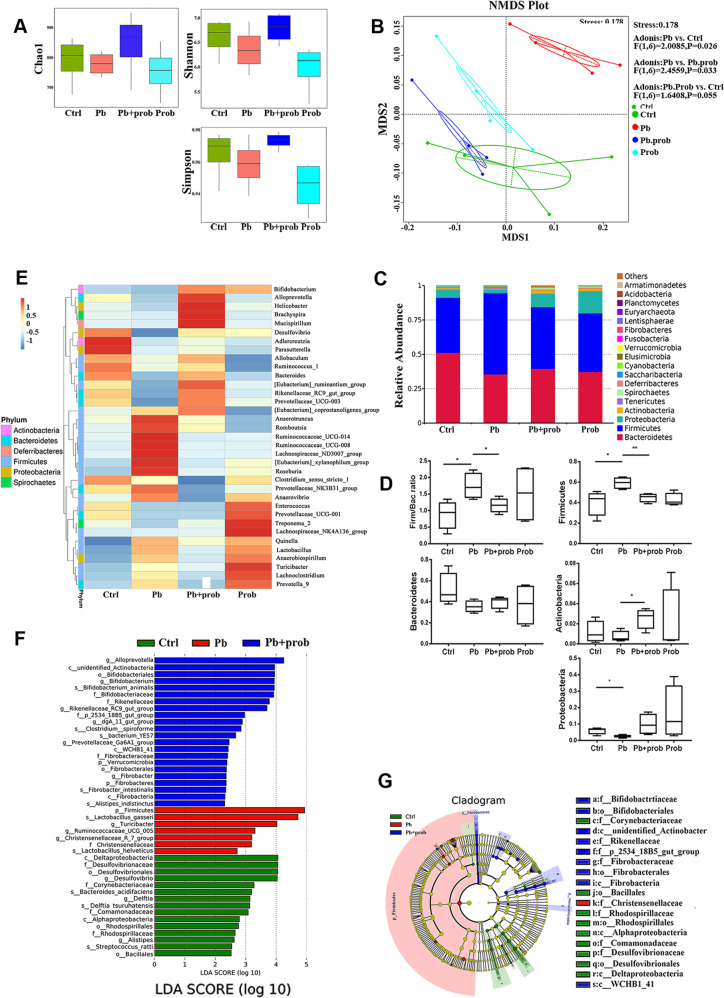
Fig. 3. Probiotic treatment restored specific microbiota changes in lead-exposed rats (n = 6).
a Analysis of alpha diversity-predicted diversity of gut microbiota by Chao1, Shannon, and Simpson analysis. b Non-metric multi-dimensional scaling (NMDS) analysis based on unweighted UniFrac metrics of gut microbiota where samples of rats from different groups are highlighted with different colors. The position and distance of data points indicated the degree of similarity in terms of bacterial taxonomies. The Permanova/Adonis analysis was shown on the right-upper corner. c Stacked bar chart shows microbiota composition at the phylum level. d Relative abundance of the major phyla of gut microbiota upon each treatment. e Heatmap shows relative abundance of representative microbiota at the genus level in four groups. f Microbial taxa identified to significantly differ in abundance (LDA score >2.0, P < 0.05) across the tested groups (Ctrl, Pb, Pb+prob) using LEfSe analysis. g A cladogram representation of LEfSe analysis. The plot shows microbial taxa from phylum to genus level, with taxa significantly enriched (P < 0.05) in the Pb group indicated in red and in Pb+prob indicated in blue. Abbreviations for microbial names are listed right to the graph. Ctrl non-treated rats, Pb lead-treated rats, Pb+prob lead and probiotics-treated rats, prob probiotics-treated rats. The data are represented as mean ± SEM; **p < 0.01, *p < 0.05. p Value was FDR corrected in multiple (>3) comparisons.

