Figure 4.
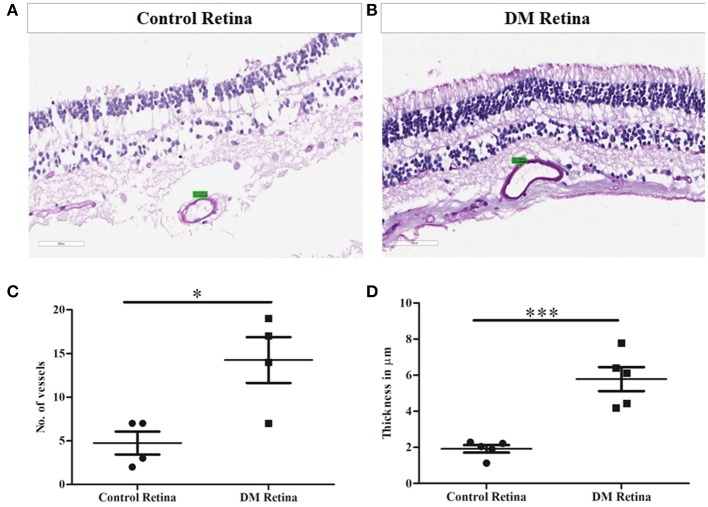
Representative photomicrograph showing thickened and dilated blood vessels in diabetic retina (B) in comparison to control retina (A) (Periodic acid-Schiff, Magnification: 40X). (C) Quantification of number of capillaries in diabetic vs. control retinal tissues. (D) Quantification of capillary thickness in diabetic retina vs. control retina. *p = 0.01, ***p = 0.0006.

