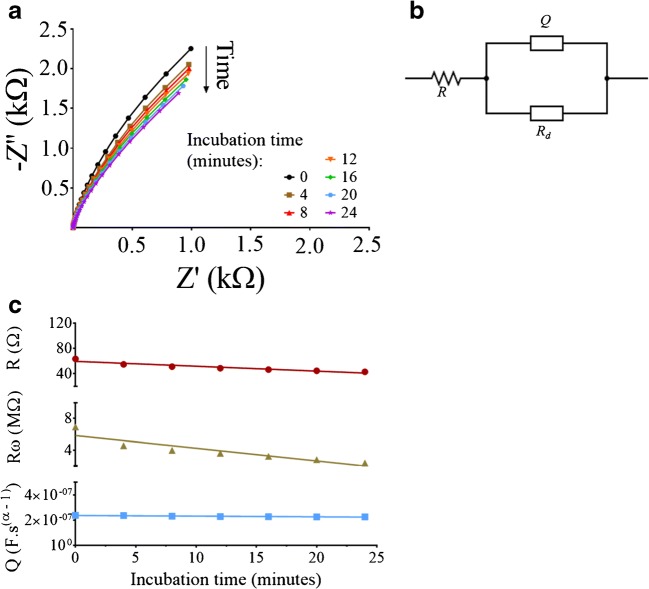
Fig. 4.
Antigen incubation time affects the bioelectronic interface. (a) EIS was measured six times, once every 4 min for 24 min total. Concentrations of 1 μg antibody and 50 fg antigen were used for these measurements. The measurements were performed at a fixed potential of 0.23 V vs. the Ag/AgCl, at a frequency range of 1 MHz to 1 Hz, a 25 mV amplitude, and three measurement points per decade. (b) The equivalent electrical circuit used to fit the physicochemical bioelectronic interface. R is the resistance element, Q is the constant phase element, and Rd is the anomalous diffusion Ia element with a reflecting boundary. (c) The dependence of R휔 (yellow), R (red), and Q (blue) on the incubation time. Fitting to the equivalent electrical circuit was done using the Z-Fit Bio-Logic tool. Linear regressions and data processing were performed using Prism Graphpad 7.0

