Fig. 5.
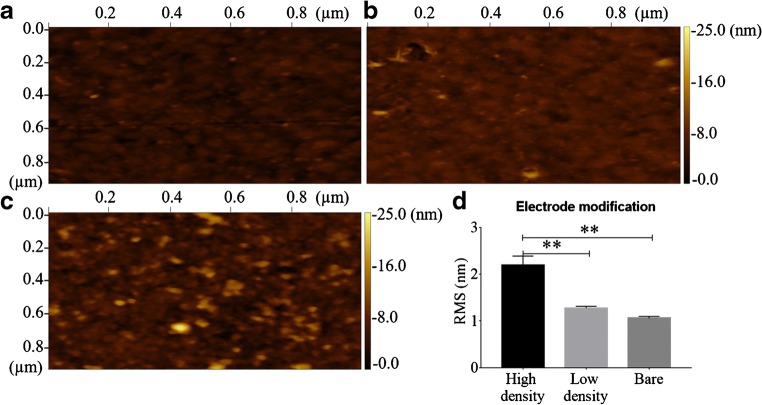
Antibody concentration affects the roughness of a modified gold electrode. Force micrographs of a bare electrode (a) and electrodes modified with low (b) and high (c) concentrations of antibody (100 pg and 1 μg, respectively). An area of 1 μm2 was scanned each time. (d) Ordinary one-way analysis of variance (ANOVA) of the surface roughness (RMS), differentiating between each modification. Three separate locations on the electrode for each condition were used for the analysis; they are represented as the mean with SD. Adjusted p-values of 0.05 (*), 0.01 (**), 0.001 (***), and 0.0001 (****) were considered statistically significant

