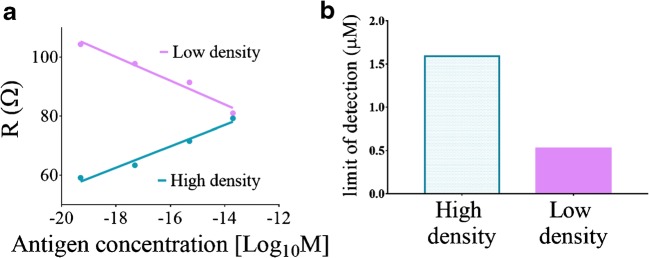
Fig. 6.
The effect of the antibody concentration of the antigen sensing performance. (a) Representative analysis results of the EIS measurements of the high- and low-density antibody-modified electrodes with increasing amounts of antigen (0, 50 fg/μl, 5 pg/μl, 500 pg/μl, and 20 ng/μl). The analysis was performed using the equivalent circuit mentioned in Fig. 4b. Low density is denoted by pink and high density by turquoise. (b) Limit-of-detection (LOD) calculations of both the high (high-density) and the low (low-density) antibody concentrations. The LOD values are expressed as three times the standard deviation of the low concentration divided by the slope of the calibration line

