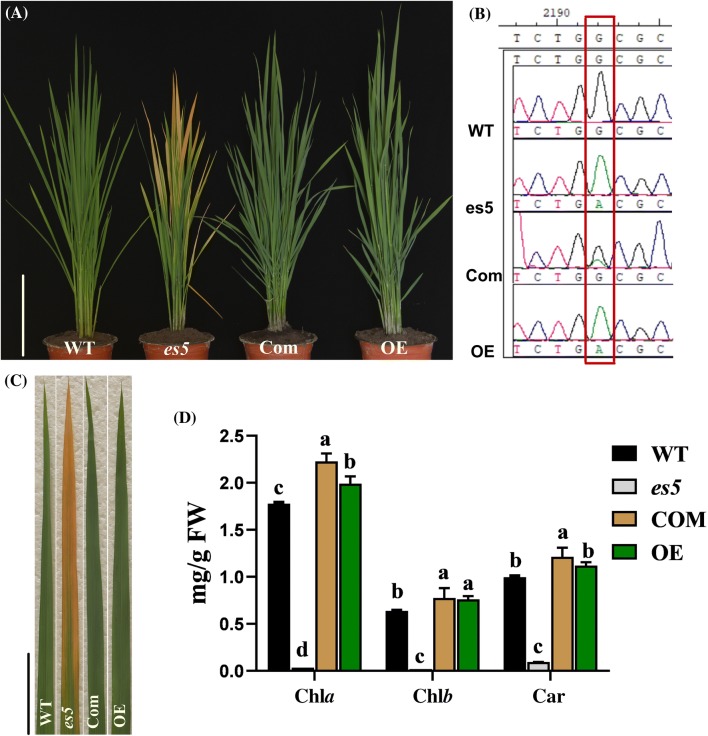
Fig. 5.
Complementation and overexpression analysis of ES5 gene in es5 mutant. a. Phenotype of WT, es5 mutant, complementation and overexpression plants at tillering stage; scale bar = 30 cm. b. Sequencing analysis of the ES5 in T0 transgenic plants. c. The leaf color from each plant; scale bar = 5 cm. d. Photosynthetic pigment contents of leaf WT, es5, complementation and overexpression plants. Data = mean ± SD (n = 3). Letters in the figure indicate the result of multiple comparison test; a, b, c indicate the significant differences on 0.05 level

