Figure 6.
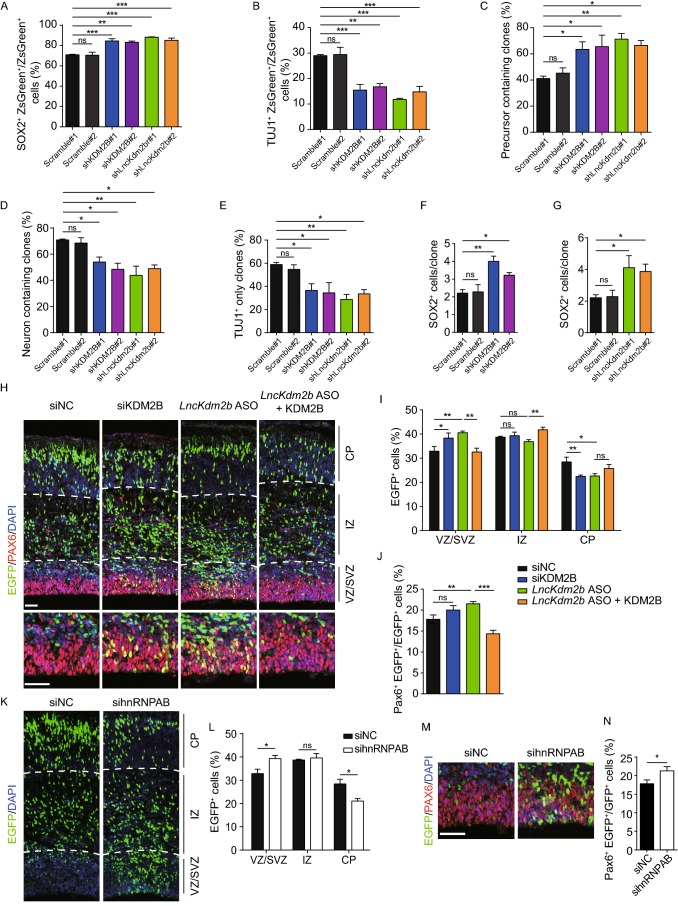
LncKdm2bmaintains mouse cortical neurogenesis through KDM2B. (A–G) E12.5 cortical neural precursors were infected with lentivirus expressing indicated shRNAs for three days followed by immunostaining of SOX2 and TUJ1. Transfected cells were labeled with ZsGreen. Quantification analyses were performed to calculate percentiles of SOX2+ (A) or TUJ1+ (B) ZsGreen+ transduced cells; percentiles of clones with at least one SOX2+ precursor (C), clones with at least one TUJ1+ neuron (D), neuron only clones (E); and the average number of SOX2+ cells in SOX2+ clones (F and G). (H–J) E13.5 mouse cortices were electroporated with indicated siRNAs and vectors, with transduced cells labeled with EGFP. Embryos were sacrificed at E16.5 for PAX6 immunofluorescent staining (H). The relative location of EGFP+ cells (I) and percentiles of PAX6+ transduced cells (J) were quantified. Three embryos in control (siNC), five embryos in siKDM2B, LncKdm2b ASO, and LncKdm2b ASO plus KDM2B. (K–N) E13.5 mouse cortices were electroporated with indicated siRNAs, with transduced cells labeled with EGFP. Embryos were sacrificed at E16.5 for PAX6 immunofluorescent staining (M). The relative location of EGFP+ cells (L) and percentiles of PAX6+ transduced cells (N) were quantified. Three embryos each. In (A–G), (I and J), (L), and (N), quantification data are shown as mean + SEM. (L) and (N) * indicates P value < 0.05, ** indicates P value < 0.01, *** indicates P value < 0.001, “ns” indicates no significance. Scale bars, 50 μm. VZ, ventricular zone; SVZ, subventricular zone; IZ, intermediate zone; CP, cortical plate

