FIGURE 8.
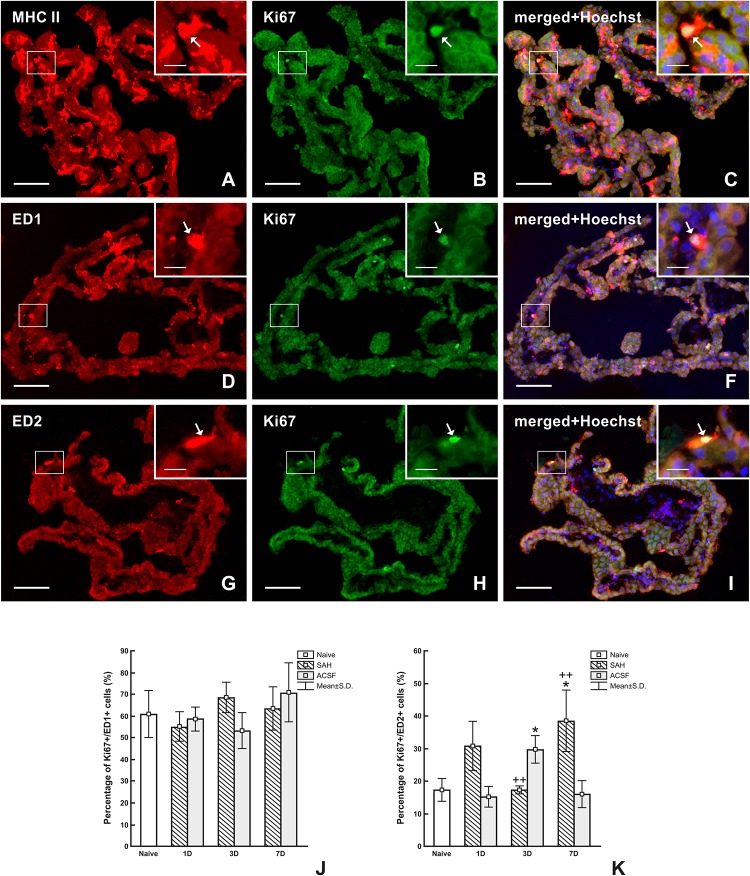
Representative images of double immunostaining to detect MHC II+, ED1+, and ED2+ macrophages as well as Ki67+ cells in the CP 7 days after SAH. Double immunostaining for MHC II and Ki-67 (A–C) showed that all proliferating cells are antigen presenting cells (arrows). Simultaneous reaction for ED1 and Ki67 (D–F) proved that most proliferating cells are activated macrophages (arrows). Double immunostaining reaction for ED2 and Ki-67 (G–I) showed that approximately one-third of proliferating cells are resident macrophages (arrows). Merged figures (C,F,I) include a merge with Hoechst-stained nuclei. Scale bars – main images 80 μm; insets 20 μm. Percentage of ED1+/Ki-67+ cells (J) and ED2+/Ki67+ cells (K) in the CP of naïve, SAH and ACSF rats at 1, 3, and 7 days after operation. *Indicates a significant difference when compared to CP from naïve rats (p < 0.05). ++Indicates a significant difference when compared to CP from control rats (p < 0.01).

