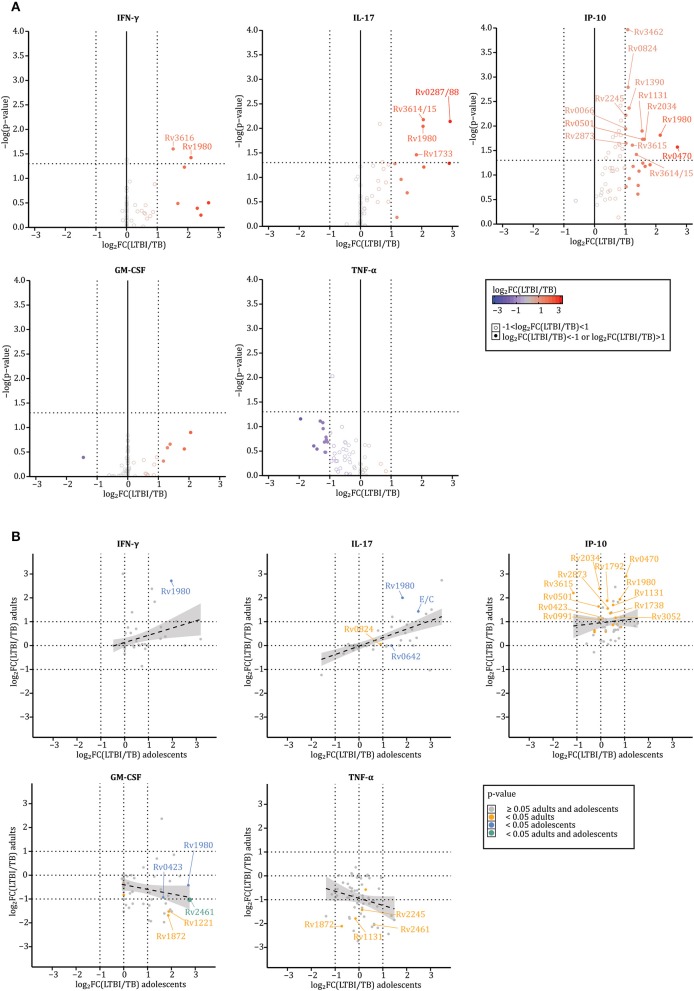
Figure 2.
LTBI individuals' and TB patients' blood cells secrete different amounts of cytokines in response to IVE-TB and stage specific Mtb antigens. The levels of nine cytokines were measured in diluted whole blood supernatants after 6 days stimulation with either IVE-TB, DosR, Rpf antigens (10 μg/ml), ESAT6/CFP10 (E/C) (10 μg/ml), PPD (5 μg/ml), or PHA (2 μg/ml). The cytokine responses were compared between LTBI donors (n = 17) and TB patients (n = 18). This comparison is displayed for five cytokines, TNF-α, GM-CSF, IFN-γ, IP-10, and IL-17A, which were found to be significantly increased in stimulated samples compared to unstimulated ones (Figure 1). Within each donor, prior to further analysis, the pg/ml values detected in response to every antigen were normalized to the background-values, i.e., divided by the medium, and then log2 transformed. Results are reported only for Mtb antigens that induced increased cytokine levels compared to the background-values. (A) Cytokine differences were assessed by Mann–Whitney U-test (significant for p-values < 0.05) and by median log2 fold-changes [log2FC(LTBI/TB) > 1 or <-1). P-values and median log2 fold-changes are reported on the y and x axes, respectively. Thresholds for p-values and median log2 fold-changes are indicated by dotted lines intersecting the axes (x:−1 and 1; y: 1.30103). Closed circles define when the log2FC(LTBI/TB) is >1 (red) or <−1 (blue), such that closed red circles define antigens inducing higher responses in LTBI donors than TB patients, while blue circles depict antigens inducing higher responses in TB patients than LTBI subjects. Open circles define when the log2FC(LTBI/TB) is >−1 and <1 (gray). (B) Differences between LTBI and TB patients were analyzed separately among adults (TB n = 8; LTBI n = 12) and adolescents (TB n = 9; LTBI n = 6). X and y-axes indicate the median log2 fold-changes in adolescents and adults, respectively. The color-coded dots indicate p-values: ≥0.05 in adults and adolescents (gray), <0.05 in adults (orange), <0.05 in adolescents (blue), and <0.05 in adults and adolescents (green). The gray area around the regression line (dotted line) represents the range in which the true regression line lies at a 95% level of confidence. Both in (A,B), the Rv numbers are coupled to antigens recognized differently by LTBI and TB according to both p-values and median log2 fold-changes.

