
Fig. 3.
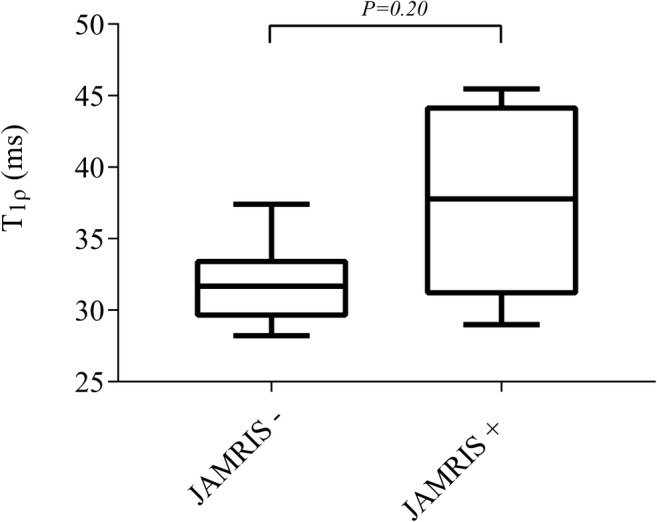
Boxplot shows the difference between T1ρ values in MRI-inactive disease on the left and MRI-active disease on the right. JAMRIS juvenile arthritis MRI score. P<0.05 is significant
Official websites use .gov
A
.gov website belongs to an official
government organization in the United States.
Secure .gov websites use HTTPS
A lock (
) or https:// means you've safely
connected to the .gov website. Share sensitive
information only on official, secure websites.
Boxplot shows the difference between T1ρ values in MRI-inactive disease on the left and MRI-active disease on the right. JAMRIS juvenile arthritis MRI score. P<0.05 is significant