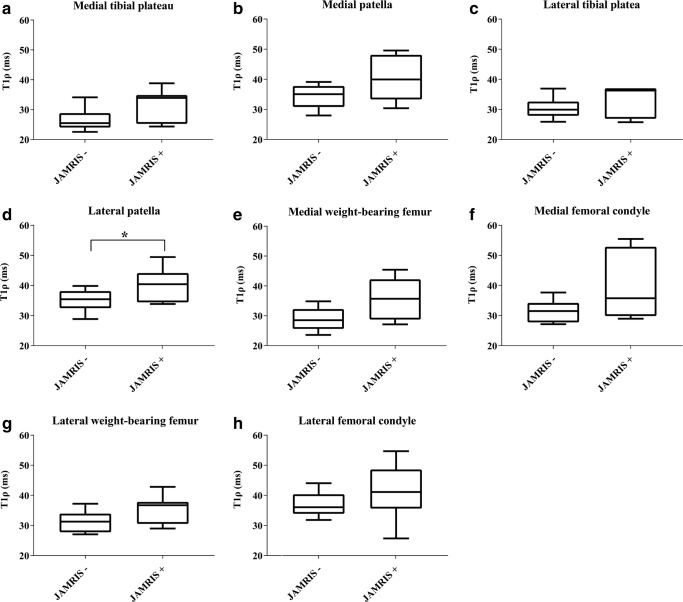
Fig. 4.
Boxplots of T1ρ values by MRI-inactive disease (left in the boxplot, juvenile arthritis MRI score –) and MRI-active disease (right in the boxplot, juvenile arthritis MRI score +). a–h Readings within the medial tibial plateau (a), medial patella (b), lateral tibial plateau (c), lateral patella (d), medial weight-bearing femur (e), medial femoral condyle (f), lateral weight-bearing femur (g) and lateral femoral condyle (h). Consistently, all regions of interest show lower T1ρ values for children with MRI-inactive disease. Significant difference was only seen in the lateral patella (P=0.046). JAMRIS juvenile arthritis MRI score

