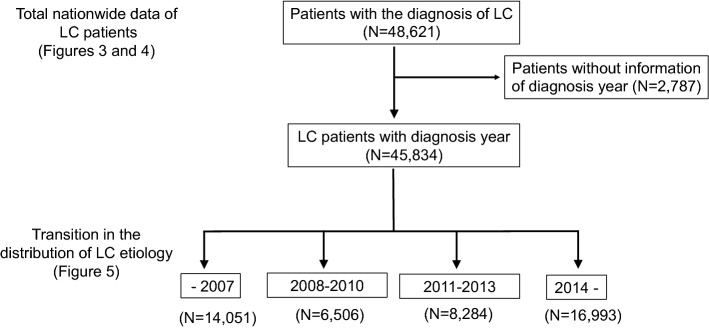
Fig. 1.
Flowchart of the current study. We first assessed the total nationwide data of all LC patients (N = 48,621). Then, we excluded the data of patients whose records did not include information on the year of diagnosis and evaluated the transition in the distribution of the etiologies of LC (N = 45,834). To assess the general trends in the etiologies of LC, we classified the patients into four groups (–2007, 2008–2010, 2011–2013, and 2014–)

